


Tourmaline Oil Corporation
A play on AI and Geopolitics!

In 2023, about 4.18 trillion kWh of electricity were generated at utility-scale electricity generation facilities in the United States. Out of this natural gas had a 43% share! For reasons we will discuss below, natural gas is cleaner than many other fossil fuels and is known as a ‘transition’ fuel.
Due to AI, longer term, power demand from IT equipment in U.S. data centers is expected to reach more than 50 gigawatts (GW) by 2030, up from 21 GW in 2023, according to consulting firm McKinsey's latest estimates. We have to assume that natural gas will play a very important role in US electricity mix and base load demand for a long long time. If it only maintains its share of the overall mix then we are potentially looking at mid to high single digit growth in natural gas demand for power generation!
In addition, record amounts of LNG capacity is coming online in North America over 2024-2028. With Russia out of the picture in Europe, North American gas is required to fuel Europe and Asia. The U.S. has seen a substantial increase in LNG export capacity due to the construction and expansion of several LNG terminals along the Gulf Coast and other coastal regions. After this, like oil, perhaps gas will become a global commodity with global pricing.
But here is the long term chart of natural gas prices:
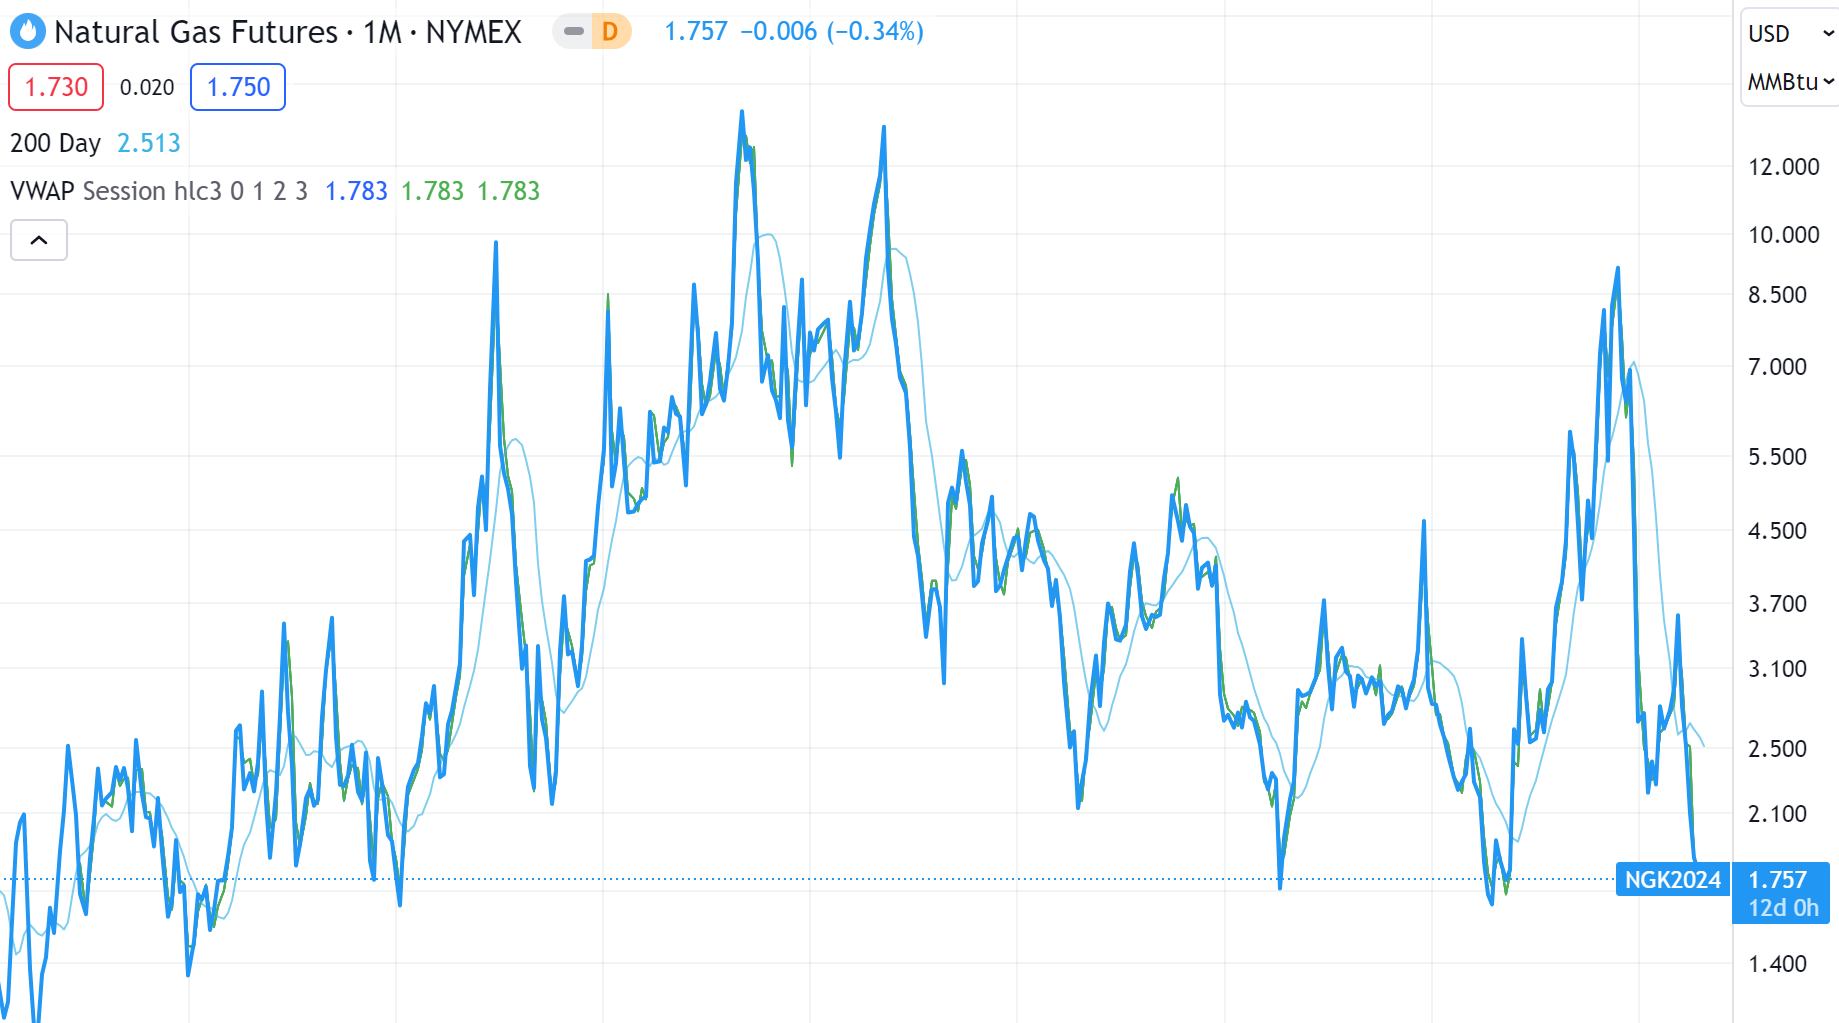
Did traders not get the memo?
We believe that the current depressed price of natural gas is temporary and a direct result of weak seasonal demand. Over the medium and long term, power generation and LNG are strong and durable structural forces that will propel demand and price of natural gas up and to the right.
We have written extensively about oil and gas in the past. In this report, we will do a deep dive into the dynamics of LNG and then delve into Tourmaline as our preferred way to play the natural gas thesis.
LNG
Liquefied natural gas (LNG) refers to natural gas that has undergone a cooling process, reducing it to a liquid state at approximately -260° Fahrenheit (or around -162 Celsius), facilitating its shipment and storage. When in its liquid form, the volume of natural gas is about 600 times smaller than its volume as a gas. This transformation process is known as liquefaction. LNG is stored and transported via specialized vessels across oceans to designated receiving terminals responsible for storing the liquid LNG. Subsequently, it is directed to re-gasification facilities, where it is converted back into its gaseous state, enabling it to be transported to end users through pipelines. This entire procedure allows for the transportation of gas to locations lacking pipeline infrastructure, greatly enhancing the marketability and mobility of natural gas.
Advantages of LNG
LNG or natural gas as this is what the final end product is, has multiple advantages. They are listed below
When natural gas is burned, it produces fewer pollutants and greenhouse gases than gasoline or diesel. The combustion of natural gas results in significantly lower emissions of CO2, NOx, and SO2, and almost no ash or particulates, which are tiny, harmful components of air pollution that can deeply penetrate the lungs. Additionally, natural gas evaporates quickly when exposed to the air, leaving no residue on water or soil. These environmental benefits, in a world which wants to decarbonize, makes natural gas/LNG a preferred choice over crude oil or coal.
Natural gas is well-suited for Combined heat and power (CHP) systems, also known as cogeneration, which allow simultaneous production of electricity and useful heat from the same energy source. Natural gas power plants often have higher thermal efficiency, which means they can convert a larger portion of the fuel's energy into electricity. Combined cycle power plants use both gas and steam turbines, further enhancing overall efficiency.
LNG has the capability to be stored for prolonged periods, ensuring a consistent energy supply. This feature renders it valuable for addressing peak power requirements and serving as a contingency energy source during disruptions in other energy provisions. Typical peak demand times may coincide with sweltering summer days or chilly winter days. Typically, peak power needs arise during the afternoon when businesses are at their busiest and in the evenings when household appliances are in operation. In such scenarios, natural gas power plants are frequently employed as peaker power facilities due to their dispatchable nature, allowing for rapid activation, deactivation, and swift output adjustments.
“Natural gas is the best way to back that up in any scenario. When the wind's not blowing and the sun's not shining, you can bring natural gas turbines on to generate power within a matter of minutes, and you can store natural gas underground through existing reservoirs that we already have to give you that long-term sustained months of storage for energy needs that you might have.”
-Former Senior Engineer, Kinder Morgan, August 2023 (Alphasense Expert Call)1
Last but not the least, natural gas transformed into LNG can be transported to areas where natural gas is not abundant. This has benefits for the producer as it finds a buyer while the receiver gets access to a reliable base load fuel source, which is consistent compared to solar or wind energy. The receivers of LNG can also save their capital on building gas related infrastructure where the economics are not attractive due to insufficient supply, inconsistent demand, troublesome regulations and financing issues
Because of the aforementioned benefits of cleanliness, efficiency, consistency and most importantly, transportability, has brought LNG to limelight in recent years. Following the Russia/Ukraine conflict, and in light of Europe's efforts to reduce its dependence on Russian gas, there has been a surge in demand for LNG.
LNG infrastructure
The LNG value chain begins with the extraction of natural gas from underground reservoirs. After extraction, this gas, often called ‘feed gas’, must be sent to a processing facility for treatment prior to liquefaction. Upon the removal of impurities and liquids, the natural gas is ready for the liquefaction process. In the liquefaction facility, natural gas is transformed into a liquid state at atmospheric pressure through a cooling process, bringing it to a temperature of -260° Fahrenheit (or around -162 Celsius). Liquefaction plants are commonly organized with several parallel processing units, known as "trains." While each train functions as a self-contained processing unit, it's typical to have multiple trains constructed alongside one another.
Liquefaction is often the costliest part within the value chain. In response to environmental concerns and the remote offshore locations of resources, floating liquefaction solutions have been introduced. With floating liquefaction, all processes take place on the sea-based vessel. While the underlying liquefaction principles remain similar, the maritime setting and space constraints on the vessel necessitate somewhat different technological solutions.
After natural gas has been transformed into its liquid form, it is ready to be transported to specialized LNG ships or carriers with regasification facilities as the final destination. When LNG ships reach the terminals, the LNG is reverted to its initial gaseous state through a controlled increase in temperature. Typically, regasification takes place at an onshore import terminal, which encompasses docking facilities for the LNG carrier, one or more cryogenic storage tanks to hold the LNG until regasification capacity is accessible, and a regasification plant. Subsequently, the re-gasified natural gas is directed to its ultimate consumers, which may include power stations or transmission through pipelines. Figure 1 depicts the typical LNG cycle.
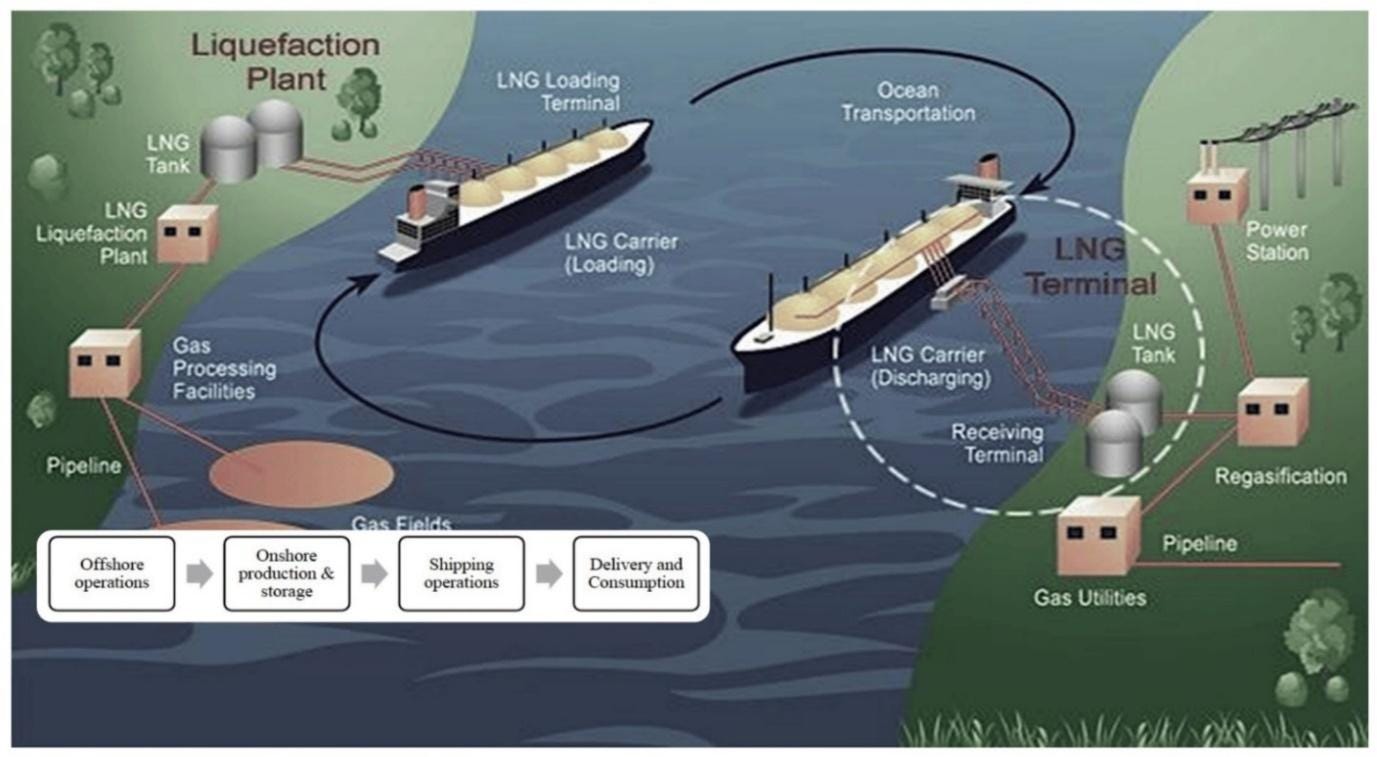
Figure 1: Full-cycle representation of LNG process2
LNG Demand/Supply
LNG demand is expected to grow robustly as shown in Figure 2.

Figure 2: Global LNG supply vs demand forecast range4
Shell’s latest LNG outlook4 which is Shell’s interpretation of data from Wood Mackenzie, Poten & Partners, IEA, S&P Global Commodity Insights, all leading energy consulting firms. Based on the figure, close to 200 MTPA (26 bcf/d) of LNG supply will come online in the next few years. However, the current demand forecast range still comfortably exceeds the overall supply with a gap of around 150-225 MTPA (19-30 Bcf/d). For context, the biggest LNG producers, Australia, Qatar and US produce approximately 11 Bcf/d each today. Therefore, a demand range between 19-30 Bcf/d till 2040 leaves plenty of room for new investment and production to come in with profitable economics.
The biggest LNG exporters globally include countries like USA, Qatar, Australia, Russia and Malaysia. Collectively, the market share of these five countries amounted to 78% in 2022.
Here is some further information on some major players:
USA
According to EIA, The United States exported more liquefied natural gas (LNG) than any other country in the first half of 2023 (1H23)5. U.S. LNG exports averaged 11.6 billion cubic feet per day (Bcf/d) in 1H23, 4% higher than the same period last year.
67% of US LNG exports went to EU countries and the UK as European countries kept refilling their storage inventories. Apart from dry gas production, high crude oil prices led to increase in natural gas production, with associated gas production from oil wells pitching in to contribute towards record LNG exports. Supply comes from a handful of regions, with production coming from shale including gas plays like the Marcellus, Haynesville, and Barnett shales as well as from associated gas from unconventional oil plays like the Permian, Bakken and Eagle Ford. The total net gas exports from USA averaged 13.6 Bcf/d, which means that 2 Bcf/d of natural gas was exported through pipelines (15% of total natural gas exported). For context, total US natural gas production amounted to ~97 Bcf/d in 2022, so the net exports are ~11% of the total gas production, while 89% is consumed domestically6.

Figure 3: US Natural production, consumption and net exports5
Recently, U.S. President Joe Biden paused approvals for pending and future applications to export liquefied natural gas (LNG) from new projects, a move that analysts believe was made under pressure from climate activists and large industrial companies who may be afraid of rising domestic gas prices as US starts to export more gas in the form of LNG. Since 2024 is election year, this could easily be a tactic to pacify the liberal voters. While this pause may affect the FIDs for LNG projects in the short term, the wider impact is not clear today.
If this decision were to be reversed post elections, it is expected that North American gas will continue to be exported resulting in higher domestic prices. Since most of the LNG infrastructure is being built in USA instead of Canada, the Canadian companies could be the indirect beneficiaries of a tight US gas market. This would likely happen as most US based gas companies would sell their gas at a higher LNG pricing instead of Henry Hub pricing resulting in a shortage of US domestic gas that Canada stands primed to fulfil.
Qatar
Qatar’s LNG exports stood at 10.4 Bcf/d in the first half of 2023. Qatar plans to gradually increase the country’s export capacity to 19.7 billion cubic feet per day (Bcf/d) when the six new liquefaction trains linked to two new North Field LNG export terminal projects enter commercial service. These projects would boost its LNG output by 64% by 2027. Qatar has also signed 27-year agreements with Shell and Total for supplying LNG till 20537.
Australia
Australia is third on the list of world’s biggest LNG exporters with exports of 10.4 Bcf/d in the first half of 2023. However, Australia’s LNG outlook is not as rosy as in the past. Australia has seen only one LNG project reach a final investment decision since 2012. On the other hand, underperforming coal-fired generation, insufficient renewables, and a long-predicted gas supply crunch has really squeezed gas supply which is now intended to be used domestically rather than as LNG exports8. The chart below from Shell’s energy outlook shows the expected LNG supply growth till 2050, with US and Qatar being the leading providers4.
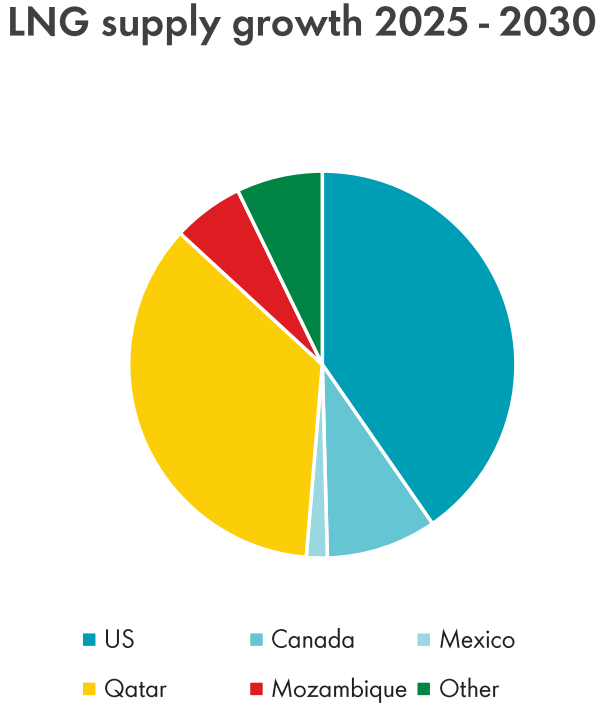
Figure 4: Global LNG Supply Growth (2025-2050)4
Canada
In October 2018, Shell, in collaboration with four joint venture partners, took a final investment decision to develop LNG Canada, a major liquefied natural gas processing facility located in Kitimat, British Columbia. The project, expected to come online in 2025, will have the capacity to produce 1.9 Bcf/d. Additionally, there is the potential to enhance the export capacity by doubling it (~4 Bcf/d) through the expansion of the facility, potentially incorporating up to four processing units. This expansion could position Canada as a key player in the LNG market.
Capital Investments involved in a typical LNG project
Constructing a full-scale LNG project is no mean feat. As with any major engineering project, substantial capital comes into play. Some of the big LNG projects whose costs are publicly available include9
Gorgon project in Australia: Total capital cost of $53 billion with three trains and a total LNG capacity of 15.6 MTPA)
Yamal project in Russia: Total capital cost of $27 billion with three trains and a total capacity of 16.6 MTPA)
Bintulu train 9 in Malaysia: Total capital cost of $2.5 billion with a capacity of 3.6 MTPA
Following is a discussion of the main cost elements of an LNG project
Upstream expenses, often referred to as extraction or production costs, typically make up 10% to 20% of the total expenditure. These costs can vary based on factors like field location, depth, reservoir quality, and contractual agreements between the producer and landowner. To make the incoming feed gas suitable for pipelines, it needs to undergo a purification process. Additionally, more valuable NGLs like propane and butane are separated to be sold separately, thereby enhancing project economics.
As mentioned earlier, Liquefaction is the most capital-intensive part of an LNG project. Liquefaction costs can amount anywhere between 25% to 50% of the overall cost. In terms of capital cost per unit of installed capacity, the number has varied from $600/tpa to $2000/tpa over the past 20 years or so10.
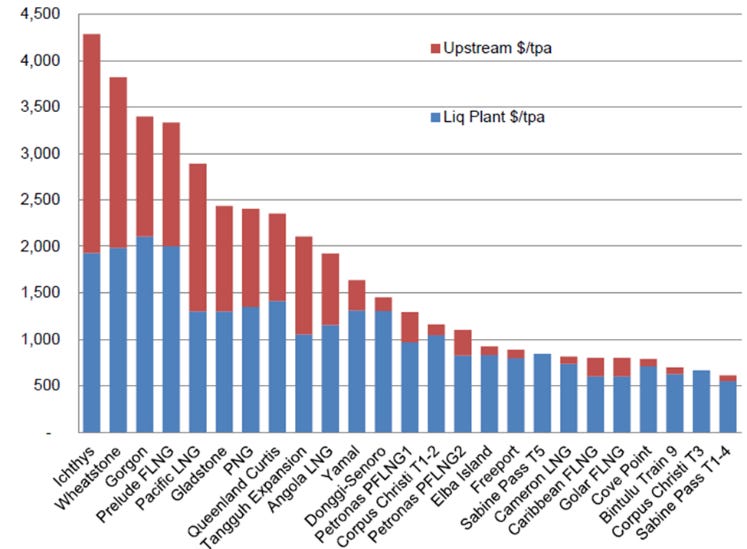
Figure 5: Overall Project Capital Costs ($/tpa) constructed between 2014–1810
LNG is preserved in sizable storage tanks before being discharged through cryogenic pipelines. The storage tanks provide flexibility for tanker scheduling flexibility and can also serve as a contingency during both scheduled and unscheduled maintenance. he expenses related to storage and unloading facilities make up roughly 15%-25% of the capital expenditure (CAPEX).
Being remote, liquefaction terminals often have to manage their own utilities for power generation, water supply, and transportation logistics. These added cost factors typically constitute 20-25% of the project's CAPEX.
Other factors contributing towards the CAPEX are feed gas quality (lean or rich gas), whether the project is greenfield or brownfield, availability and cost of labor, financial considerations like project funding, interest rates and government regulations.
LNG Pricing
Following is an example of LNG pricing for a US based LNG project. The LNG pricing begins with the cost of liquefaction, which has two different components. One is the variable component, which is linked to the natural gas price at Henry Hub. On average, the cost is 115% of the natural gas price at Henry Hub (Assuming $2/MMBtu at Henry Hub, we arrive at a total variable cost of $2.3/MMBtu). Then a constant gets added to the formula which is a fixed number ranging from $2/MMBtu on long-term projects up to $3.5/MMBtu for mid-term buyers. Typically, the longer-term buyers are utility companies that commit to 15 to 20 years of contract.
Then, the cost of transportation or shipping costs gets added. The shipping cost depends on the distance and location and stands at roughly $1/MMBtu today. Then, the regasification cost is added, which also has a variable and fixed component. The fixed component depends on whether the regasification capacity is booked on a long-term basis or spot basis. Fixed cost can therefore vary widely in the range of $0.5-$2/MMBtu, so let’s pick $1/MMBtu for this exercise while the variable cost is in the range of $0.2-0.30/MMBtu.
So, here is how all the numbers add up
Liquefaction cost (fixed + variable): $2.3/MMBtu + $2.75/MMBtu
Shipping cost: $1/MMBtu
Regasification cost (fixed + variable): $1/MMBtu + 0.30/MMBtu
Total cost = $7.35/MMBtu
“Assuming this LNG cargo is to be sold in Europe, we would have to consider TTF pricing (if it was to be sold in Asia, then JKM pricing would be used). If the current TTF price for LNG stands at $10/MMBtu, the margin would be $2.65/MMBtu”
-LNG pricing section is adapted from an interview with Former Head, Glencore UK, June 2023 (Alphasense Expert Call)11
Canadian LNG
Currently, the most noteworthy LNG project in Canada is the LNG Canada project. Other prominent projects that are being discussed include Cedar LNG project (capacity of 0.39 Bcf/d) and Woodfibre LNG project (capacity of 0.28 Bcf/d). Both projects are floating LNG facilities and are located in British Columbia.
On paper, Canada should theoretically maintain competitive operating costs in comparison to other LNG contenders, owing to its climate-related benefits (colder climate enhancing energy efficiency during gas-liquid-gas transformations), lower labor expenses (due to the weaker CAD relative to the USD), and a relatively stable climate, especially when contrasted with the hurricane-prone US Gulf Coast (USGC). Nevertheless, these advantages are significantly eclipsed by the substantial extra expenditure required for liquefaction capital in comparison to the well-established LNG infrastructure, regulatory clarity, and advantageous fiscal frameworks found in the USGC. The most attractive LNG areas in Canada are in its West Coast, but its remoteness and ruggedness make it super expensive to develop LNG projects. Most estimates indicate a premium in the range of 30-50%12. While Canada is one of the world’s most attractive LNG supply regions in terms of production cost, it is one of the least attractive in terms of shipping costs. Unlike most other proponent regions (for e.g., Qatar, Russia, USGC), Canada’s prolific gas basins are located at considerable distances from coastal areas. Consequently, the transportation costs in Canada range from $0.7 to $1.1/MMBtu, whereas the US Gulf Coast incurs tolls estimated at a lower range of $0.15 to $0.40/MMBtu. While Eastern Canada offers a potential option with access to European markets, its competitiveness is hampered by its proximity to shale gas from the US Northeast.
Figure 6 illustrates that when it comes to shipping to Asia, which is the primary driver of current and future demand, Canadian LNG demonstrates relative competitiveness with US Gulf Coast (USGC) greenfield LNG projects and other global initiatives, particularly when rich gas production is considered. All North American projects, except for the LNG Canada expansion, which benefits from the higher-cost LNG Canada first phase, face challenges in competing against the evident cost advantages of adding brownfield facilities in gas-rich Qatar.
Beyond the costs associated with production and transportation, there are additional complexities involved in the development of LNG projects in Canada. These complexities revolve around uncertainties in government policies related to resource development, environmental assessments, climate change regulations, regulatory obstacles, and the potential for resistance from Indigenous communities, particularly the First Nations. These factors have hindered Canada, despite its vast gas reserves, from fully engaging in the growing LNG market.
The increasing demand for natural gas from the power generation and LNG sectors reflects a global shift toward cleaner and more flexible energy sources. As countries strive to transition away from coal and reduce carbon emissions, natural gas is emerging as a preferred alternative due to its lower carbon footprint and reliability in power generation. Additionally, the expansion of LNG infrastructure enables the efficient transport and storage of natural gas, opening up new markets and meeting growing energy needs across different regions. This surge in demand is expected to drive further investment and innovation in the natural gas and LNG industries, shaping the future of the global energy landscape.
Introduction to Tourmaline
Tourmaline is the largest natural gas producer in Canada. In addition, its also the 4th largest producer of conventional liquids, the largest producer of NGLs, and the second largest condensate producer in Canada. Most of Tourmaline comes from fields in British Columbia and Alberta. After the recent merger of Southwestern Energy and Chesapeake Energy, Tourmaline is now the 4th largest gas producer in North America.
The company came into being in 2008 and IPO’ed in November’2010. Micheal Rose, the current CEO, founded the company after he sold Duvernay Oil, another company he founded for $5.9 billion. Tourmaline is Rose’s 3rd venture as he formed and sold Berkley Petroleum in 2001 as well. In that regard, Tourmaline is among the very few large oil and gas companies, with significant insider ownership and the founder still at the helm.
Production and reserves
About 78% of Tourmaline’s production comes from natural gas. The second major contributor is Natural gas liquids accounting for ~14% of the total production. As seen in the graph below, Tourmaline has been able to grow its production at 18% CAGR for the last 4 years.
Tourmaline has also grown its reserves over the past 5 years or so, which is equally impressive. While some of its reserves growth has come through acquisitions, counter-cyclical acquisitions have been a trait of Tourmaline’s management and a rock-solid balance sheet has enabled management to buy assets at cheap prices. Tourmaline’s current proved developed producing (PDP) reserves stand at ~1.2 billion Boe while proved plus probable reserves stand at 5 billion Boe.
Tourmaline has 75 years of drilling inventory left which is a huge positive in the face of rising LNG demand and maturing US shale production. On top of that, Tourmaline holds the largest Tier 1 inventory of natural gas in North America meaning it has the highest number of drilling locations remaining whose breakeven is at less than US 3$/Mcf. For context, the natural gas price in North America has hovered between 1.6 $/Mcf and 8 $/Mcf in the last 5 years, with average around 3.5 $/Mcf. Tourmaline also plans to increase its liquids production from ~119 Mbpd to 171 Mbpd, all through organic development, in the next 5 years. Overall, the company plans to grow its production from ~500 Mboe/d to 715 Mboe/d by 2028.
Tourmaline’s advantages
Lowest capital cost operator in the basin
Tourmaline’s most significant advantage lies in its low-cost operations. Since going public, the company has continually reduced operating costs, which has helped the company survive the volatility in oil and gas markets. Since 2011, the operating costs per producing barrel have gone down by ~32%. The company has also been able to reduce general and administrative expenses per producing barrel by ~45%. Tourmaline is the 4th largest Canadian gas processing midstream operator which enables it to save ~$350MM per year of cash flow by not processing its produced gas through other third-party midstream facilities.
This has resulted in growing operating leverage which has helped the company grow cash flow by 24% CAGR since 2010. Another way to look at the immense benefit of this low-cost structure is that the company’s maintenance budget and dividend are fully funded at US$1.50/mcf whilst including the capital required to grow production at 5-7% per year. If the commodity price stays above 1.5 $/Mcf, then any cash generated at those prices would be used for dividend increases/special dividends, buybacks, acquisitions or exploration. This is a highly desirable place to be as a company specially in the oil and gas sector where investors demand most of the cash flows to be returned to them. Please see figure below for visual illustration.

Figure 7: 2024 Cash flow sensitivity (Source: Company presentation)
Solid balance sheet
As of the conclusion of the 2023, Tourmaline's net debt was around 0.7 billion. Using company’s projected 2024 free cash flow of approximately 1.2 billion, the resulting debt-to-free cash flow ratio stands at a reassuring 0.6x. In the oil and gas industry, any debt-to-free cash flow value below 1 is generally considered favorable. Even if Tourmaline's estimates lean towards the optimistic side, it remains comfortably within that industry-accepted range.
Access to multiple markets
Tourmaline’s access to multiple gas markets is another major advantage. Since most of Western Canadian natural gas fields (including Tourmaline) are located at a significant distance to the major natural gas markets with limited egress capacity, the local AECO gas hub has seen substantial price differential versus Henry Hub. These price discounts can have a major impact on realized prices and cash flows, but Tourmaline has managed to keep its AECO exposure around 25% in the recent years. In 2023 and 2034, Tourmaline intends to benefit from the hedging of 30% of its production, along with strategic market access. This approach, consistent in both previous and forthcoming years, is anticipated to yield prices well above the AECO pricing, as depicted in the image below. For instance, in 2023, Tourmaline’s realized gas price was 4.83 $/Mcf, where as AECO price lagged at 2.68 $/Mcf in the same period.
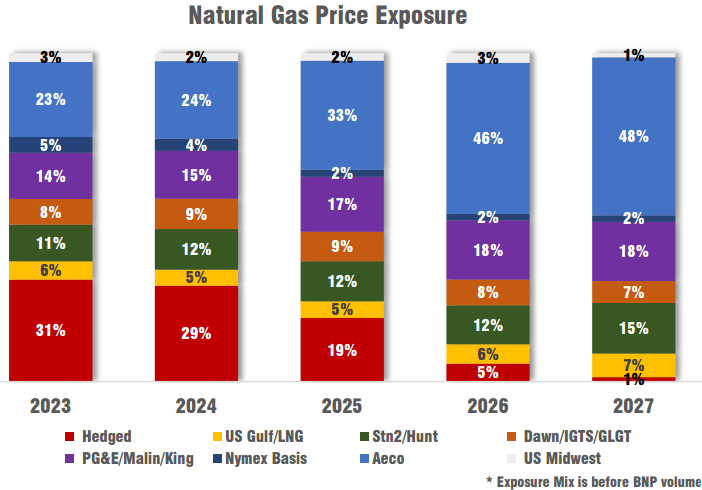
Figure 8: Natural Gas price exposure (Source: Company presentation)
LNG exposure
As mentioned above, LNG is a rapidly growing market and Tourmaline stands to benefit from it in multiple ways. First, the LNG Canada project with an export capacity of 1.8 Bcf/d is slated to come online in 2025. While we don’t know how much gas will Tourmaline be able to contract on the LNG Canada project, it is widely expected that Tourmaline will be a major supplier as LNG Canada will help drive AECO prices higher. In fact, Tourmaline has said that it is happy to keep most of 2025 and 2026 volumes unhedged as they see a competitive market for AECO pricing with the start-up of LNG Canada. On the other hand, Tourmaline is already sending down 140 Mcf/d to the Cheniere (LNG) Sabine Pass LNG facility in US Gulf Coast since Q1 of 2023. The contract term is for 15 years and Tourmaline was able to realize 14.28 $/Mcf as the facility receives JKM (Japan Korea Marker) pricing. Looking ahead, Tourmaline envisions developing its Conroy assets in two phases, each contributing approximately 100,000 boe/d by 2026 and 2028, respectively. These timelines align with the anticipated start-up of LNG Canada and other Canadian LNG projects (with a combined capacity of ~3.7 Bcf/d) in the latter part of the decade.
Addressing the potential impact of LNG on Tourmaline's business, Mike Rose said in a recent interview.
“I think the second half of this decade is going to be brilliant for natural gas prices because you get LNG starting up in Canada (and on) the U.S. Gulf Coast . . . there’s going to be a big requirement for natural gas” 13
Successful Acquisition strategy
Tourmaline has grown organically and via strategic acquisitions that capitalize on counter-cyclical opportunities. Natural gas has been a volatile industry over the past decade and Canada has definitely faced the brunt of it. However, Tourmaline's adept leadership has seized these opportunities to acquire valuable assets at favorable prices. In 2016, it bought assets from Shell Canada in the Alberta Deep Basin area and Montney properties in British Columbia for $1.4 billion while getting ~25,000 boe/d of production and 2P reserves of 473.5 MMboe. It then took advantage of COVID driven commodity crisis in 2020 to buy Black Swan Energy and Jupiter Resources for $1.1 billion and $630 million respectively. These acquisitions added ~60,000 boe/d and 87,000 boe/d respectively. In November last year, Tourmaline acquired Bonavista Energy for $1.45 billion for 60,000 boe/d.
Importantly, most, if not all of these acquisitions were strategically timed to align with counter-cyclical phases. These initiatives have empowered Tourmaline to enhance its production capacity without being solely reliant on exploration and development, illustrating a dual strategy that incorporates consistent organic growth alongside shrewd acquisitions.
Environmental friendliness
Tourmaline stands out among Canadian majors with one of the lowest greenhouse gas (GHG) emissions intensities. The company has achieved an impressive 42% reduction in CO2 emission intensity since 2013, even with a substantial 570% growth in production. While a lot of it has to do with its low emissions natural gas production instead of say oil sands, the company is still spending actively to reduce its emissions. Initiatives such as displacing diesel with natural gas in field operations, implementing low-emission controllers, integrating waste heat recovery, and utilizing non-potable water in fracking underscore the company's proactive steps toward minimizing its environmental impact. These measures are crucial for maintaining a 'licence to operate,' particularly in an environmentally-conscious country like Canada.
Shareholder returns
Figure 9 highlights the growing base and special dividends policy that Tourmaline has successfully employed. The company plans to return majority of the free cash flow to the shareholders. Preferred method of these returns is through a growing base dividend and special dividends during periods of high commodity prices. This strategy has been in action since late 2021 till now with the company paying a cumulative of $13.25 per share in form of special dividends. Going forward, the investors can be confident of getting rewarded as long as the company keeps generating free cash flow.

Figure 9: Dividend history (Source: Company presentation)
Concerns/Risks for Tourmaline
Key Man Risk
Tourmaline has been ably run by Mike Rose since its inception. Rose is not only the face of the company but his industry experience, reputation, and long-term vision have bolstered Tourmaline in many different ways. It is not clear as to who will replace Rose once he chooses to retire after 38 years in the industry and how will the leadership succession play out. If there is insufficient emphasis on cultivating leadership skills throughout the organization, the departure of such key leaders may leave a significant void that is challenging to fill, potentially leading to instability and a decline in overall performance.
Energy Transition
Natural gas, while considered a cleaner-burning fossil fuel compared to coal and oil, faces several risks in the context of the ongoing energy transition. The main risk is with the concern of carbon emissions. Despite being cleaner than some alternatives, natural gas still releases carbon dioxide when burned. In the face of increasing emphasis on decarbonization, concerns about greenhouse gas emissions may impact the long-term viability of natural gas as a primary fuel source. Having said that, the emergence of LNG can definitely open more markets for Tourmaline, especially where there is still a lot of dependence on fossil fuel and there are less environmental regulations regarding the use of fossil fuels.
Valuation
Historical financials:
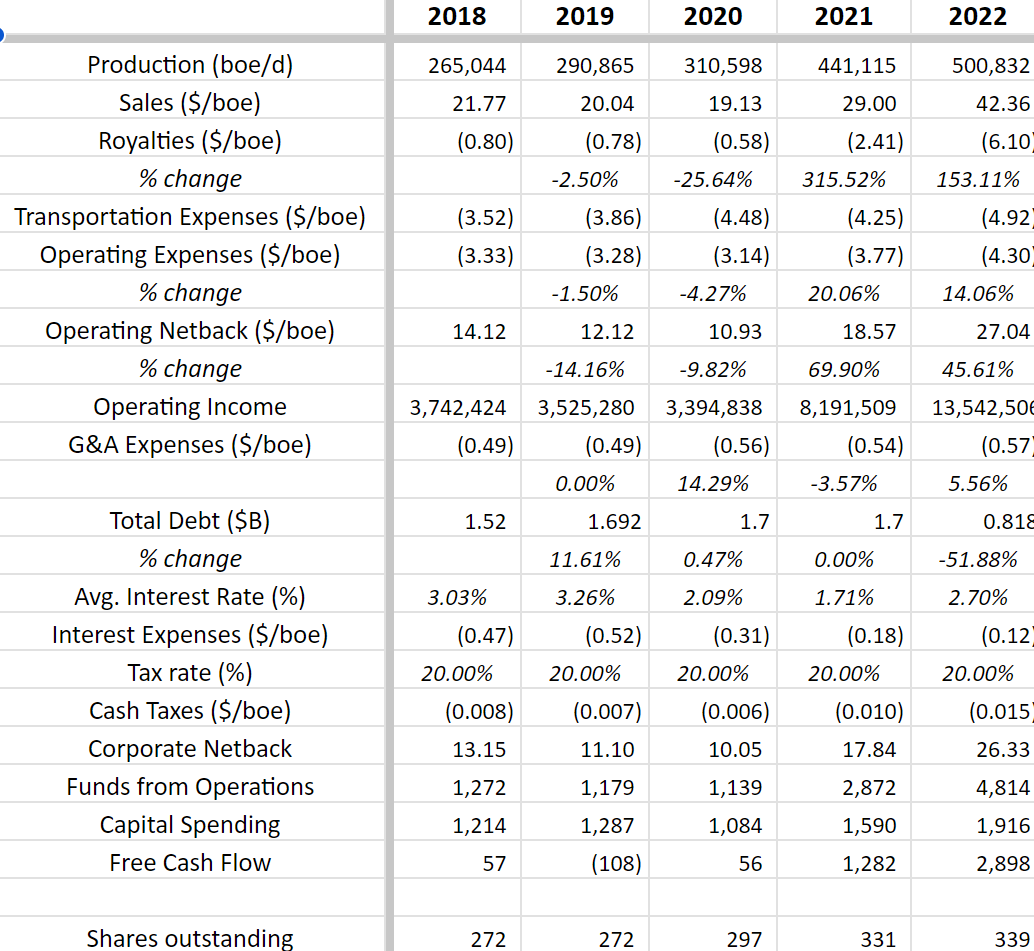
These days, majority of oil and gas investors expect the excess cash flows to be returned to them instead of reinvesting them to grow production, organically or through acquisitions.

This is why we are analyzing Tourmaline with the lens of FCF return along with some production growth. Further, in our view, its harder to predict commodity pricing, as it can be anybody's guess in the next 5 years. For a company with Tourmaline's strong operational record obtained in a cost-efficient manner, we believe making assumptions on its corporate netback number is a more accurate way. Hence, we are am assuming three different cases in which the assumptions are made on corporate netback.
In the bear case, corporate netback is assumed to drop by 30% from the last three-year average. This could result from higher operating expenses and/or lower commodity costs. Overall production grows by ~ 4% reaching 634,000 boe/d by 2028, therefore missing the company 2028 target by 82,000 boe/d. Even with these conservative assumptions, Tourmaline would generate enough cash flows to not only sustain but even grow its dividend (base + special) at a CAGR of ~15%.
In the base case, corporate netback is assumed to drop by 15% from the last three-year average. Overall production grows by 5.5% reaching 680,000 boe/d by 2028, therefore missing the company 2028 target by 35,000 boe/d. At these assumptions, Tourmaline would generate enough cash flows to grow its dividend (base + special) at an impressive CAGR of ~32%. Tourmaline would still be left with $2B in cash by 2028 which could be used for buybacks or acquisitions.
In the best case scenario, the corporate netback is assumed to remain same as the last three-year average. This indirectly reflects the benefits of wider LNG adoption and Tourmaline being able to realizer higher pricing. Overall production grows by 6.5% reaching 715,000 boe/d by 2028 meeting the 2028 company target. At these assumptions, the dividend can jump to ~ $8 per share, almost 5 times higher the current dividend. For the record, a $8 dividend capitalized at 5% would yield a $160 share price. In our view, this is not only attractive but plausible based on a long history of proven performance.
Tourmaline is a ‘heads I win, tails I do not lose’ investment from these levels. It is remarkable that natural gas prices are at all time lows even with the positive catalysts coming for the commodity in the near future.
Conclusion
In conclusion, Tourmaline Oil Corp. has established itself as a reputable and reliable natural gas company, playing a key role in North America's energy landscape. The company's strategic investments in technology and infrastructure position it to navigate the evolving energy market and contribute to the global energy transition. Tourmaline, under the able leadership of Mike Rose, is poised to continue delivering value to its shareholders.
Disclosure: The author or the editor have no position in Tourmaline at this time. The above is for informational purposes only. We may be wrong in our analysis and we encourage all readers to come to their own conclusions.
References
1 Expert Call- Alphasense Stream (2023, August 24)
2 Machfudiyanto, R. A., Humang, W. P., Wahjuningsih, N., Kamil, I., & Putra, Y. Y. A. (2023, April 6). Probability of risk factors affecting small-scale LNG supply chain activities in the Indonesian Archipelago. MDPI. https://www.mdpi.com/2412-3811/8/4/74
3 Three more countries began importing liquefied natural gas this year, and more will follow. (2023, August 30). https://www.eia.gov/todayinenergy/detail.php?id=60262
4 Shell LNG Outlook 2023 | Trends in the global LNG market | Shell Global. (n.d.). Shell Global. https://www.shell.com/energy-and-innovation/natural-gas/liquefied-natural-gas-lng/lng-outlook-2023.html#iframe=L3dlYmFwcHMvTE5HX291dGxvb2tfMjAyMy8
5 The United States exported more LNG than any other country in the first half of 2023. (2023, September 12). https://www.eia.gov/todayinenergy/detail.php?id=60361
6 Where our natural gas comes from - U.S. Energy Information Administration (EIA). (n.d.). https://www.eia.gov/energyexplained/natural-gas/where-our-natural-gas-comes-from.php#:~:text=U.S.%20dry%20natural%20gas%20production,the%20highest%20annual%20amount%20recorded
7 TotalEnergies says Qatar LNG flows could be diverted from Europe. (2023, October 26). Reuters. https://www.reuters.com/business/energy/totalenergies-says-qatar-lng-flows-could-be-diverted-europe-2023-10-26/
8 Thompson, G. (2023, February 1). Australia’s deepening gas market turmoil | Wood Mackenzie. Wood Mackenzie. https://www.woodmac.com/news/opinion/australias-gas-market-turmoil/
9 Putter, A. (n.d.). Overview of the LNG industry | OwnerTeamConsultation. https://www.ownerteamconsult.com/overview-of-the-lng-industry/
10 LNG Plant Cost Reduction 2014–18 - Oxford Institute for Energy Studies. (2019, January 2). Oxford Institute for Energy Studies. https://www.oxfordenergy.org/publications/lng-plant-cost-reduction-2014-18/
11 Expert Call- Alphasense Stream (2023, May 29)
12 Canadian LNG Competitiveness - Oxford Institute for Energy Studies. (2019, December 13). Oxford Institute for Energy Studies. https://www.oxfordenergy.org/publications/canadian-lng-competitiveness/
13 A $1.4B deal and LNG Bolster View for Canada’s biggest gas producer ... (2023, Oct 20). https://calgaryherald.com/opinion/columnists/chris-varcoe-tourmaline-oil-mike-rose-bonavista-energy-takeover