


Deep Dive: Oil & Gas
Industry deep dive + four unique ideas

Energy has been the best performing sector this year. In fact, it is the only sector that has given investors a large positive absolute return.
What’s interesting is that:
Even after the rally, many oil & gas companies are still trading at high free cash flow yields (and in some cases very high!)
Investors remain skeptical. Global funds on average are still underweight the sector, as shown below and also here (Goldman’s prime brokerage report)

Investors are perhaps uncertain that these oil prices and the resulting free cash flow yields will last. Having been burned by the poor industry returns in the most recent cycle, they may have given up altogether. Or possibly, they are bound by ESG constraints, or may be worried about the terminal value of their investments given new technologies like EVs and renewable energy. There are many reasons to explain investor skepticism today.
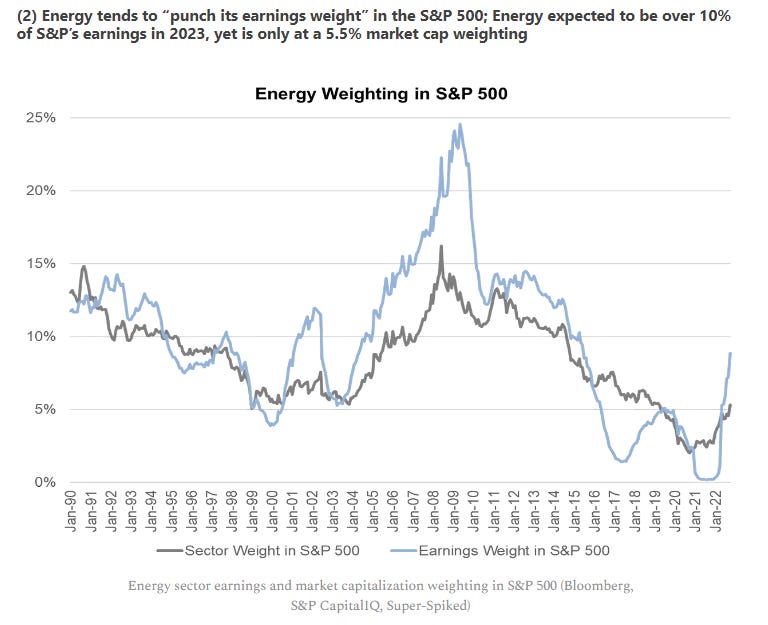
Due to these factors, the energy sector weighting is currently about 5% of the S&P 500 index. It had sunk below 2% in October 2020 (before Covid vaccines were announced), which was an all-time low. The current macroeconomic environment is often compared to the inflationary 1970’s, and there’s an important observation here.
In 1972, energy was 7% of the S&P 500, but it would peak at 28% at the end of 1980. Notably, only oil (and gold) produced positive inflation adjusted returns over the entire decade. It is important to keep in mind that if indeed the energy bulls are right this time - and even if you think that’s a big “if” - most investors with no energy exposure today could be severely mispositioned over the coming years.
Energy has a sector weight of 5% but contributes to 10% of total earnings of the S&P500 index. This is shown below. You can also see that historically sector weight has tracked earnings weight.
One needs to keep in mind that oil cycles are long, and historically up and downcycles have each lasted 15 years or longer. Even seasoned investors can spend most of their careers just living in one leg of a cycle. The mental adjustment required to adapt to a new reality is not easy. For example - someone looking at the chart below in 2012 could have convincingly told you that Exxon is a compounder. But this dynamic also works in reverse. An investor who has only seen a structural downcycle are likely to conclude that energy cannot maintain sustained outperformance given its commodity nature.

One investor who has seen more cycle than anyone is of course Warren Buffett. And Buffett has started investing heavily in oil & gas since February of this year. He most recently filed to acquire up to 50% of Occidental Petroleum (OXY) and has a big stake in Chevron (CVX). OXY has a market capitalization of $55bn and an enterprise value of $90bn so Buffett is making a sizable bet here. Notably, Buffett hasn’t bottom-ticked oil price swings - he kept buying with conviction even as oil prices kept rising to above $100 per barrel earlier in the year. We believe Buffett wants sufficient exposure to oil & gas ahead of what is in his view the start of the next long upcycle:
“I would think if you owned Occidental, you'd be bullish on oil over the years – and you’re probably bullish on the Permian Basin because they have such a significant portion of their assets there. It’s a bet on oil prices over the long-term more than anything else. It’s also a bet the Permian Basin is what it’s cracked up to be… If oil goes way up, you make a lot of money… You have to have a view on oil over time. Charlie and I have some views on that…” - Warren Buffett
Ok, so Buffett has a positive view of oil prices.
There are two ways to gain exposure in this sector - by owning the underlying commodities (e.g. oil futures) or by investing in producers. We clearly know which approach Buffett prefers. This is consistent with his preference for productive, income-generating asset. His investing style, as seen by his previous investments, is to invest in income-producing assets with long reserve life that have optionality to higher prices run by competent management.
Demand
Recently, economists at BP and Shell called for peak oil demand in 2020, and that oil demand may never recover from the impact of Covid. We now know this is not true as demand has already reached its pre-pandemic levels of ~100mn barrels per day (b/d) in 2022 (and expected to exceed this in 2023). Note that this is with China still under Covid lockdowns!

You ask - what about the demand impact from renewables and EVs?
At the end of last year, fossil fuels represented 81% of the world’s total energy consumption. Ten years ago, they were at 82%. Over the last ten years, the world had spent $3.8 trillion of investment in renewables, and that moved fossil fuels from 82% to 81% of the overall energy consumption
- Jeff Currie (Global Head of Commodities Research, Goldman Sachs)
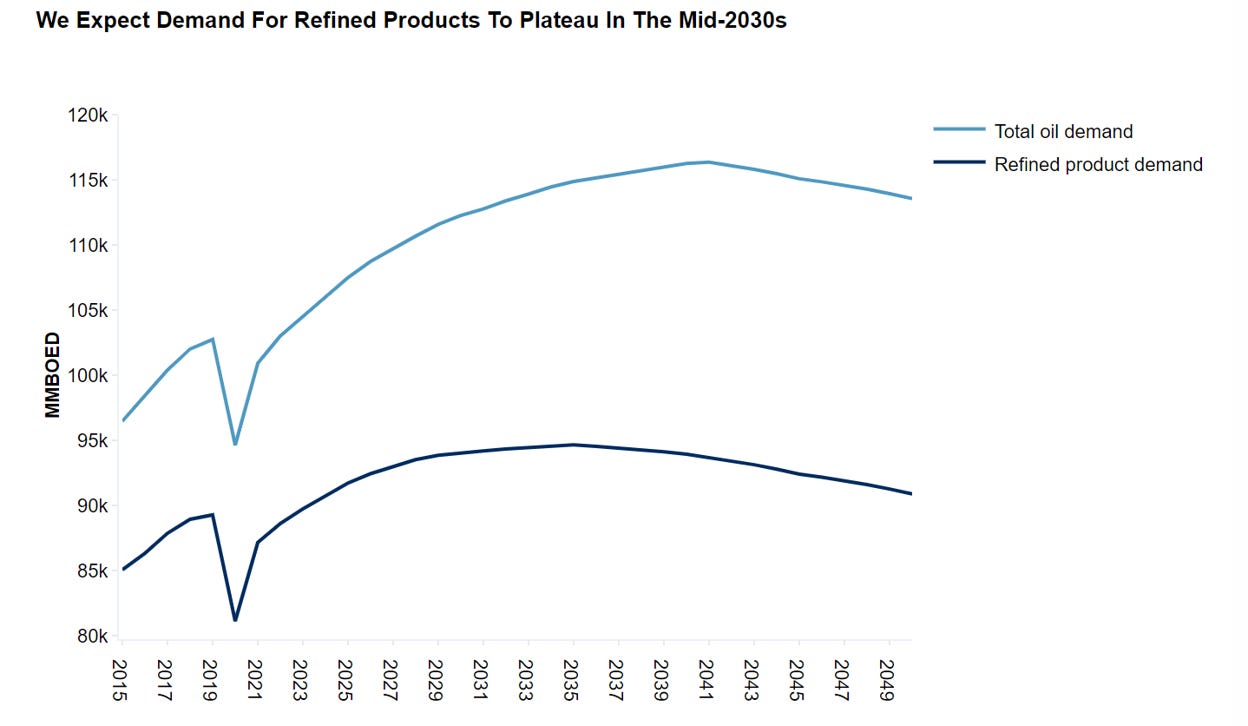
When thinking about demand for oil & gas, the first and most basic step is to distinguish between relative and absolute terms. Consider the projections by EIA and S&P Platts. Even as the share of renewable energy increases, absolute oil and gas demand is expected to rise over the next few decades. As per the EIA, petroleum and other liquids as well as natural gas consumption will rise at low single digits due to population growth and as emerging countries industrialize (even as the relative share of renewables continue to grow).

Perhaps you think the EIA is biased. But S&P Platts also does not expect oil demand to peak until the late 2030’s and into 2040.
The growth in world oil demand has been remarkably consistent, as shown below. Oil demand is a function of population growth and industrialization. The path of economic development still involves substantial consumption of fossil fuel in which there is little alternative. For example, India’s oil consumption is 51.4 gallons per capita compared to 138 gallons for China and 984 gallons for the USA. Even if OECD countries curtail their usage of oil, non-OECD countries (orange bar below chart) are still on the path to increasing usage. This is despite the world’s oil intensity (the volume of oil needed to produce a fixed economic output) declining thanks to technological improvements (e.g. engines becoming more fuel efficient)

When it comes to the impact of EVs, one can look at Norway which has the world’s highest EV penetration. According to recent estimates EVs account for 65% of all new vehicles sold in the country, and EV stock share of the car fleet has increased to about 15% over the last five years. What has been the effect on gasoline and diesel sales? They have declined by about 9% over the same period. This provides a point of reference for other markets - at what point will a country like the US reach Norway’s level of EV penetration? Yet by then, we’re still talking about demand decline that’s in the single digits.
Meanwhile, let’s not forget the fact that oil is used for purposes other than road transportation. Estimates vary but generally it falls into the range between 55-65% for “moving things” (45-50% for road transportation and 10-15% for air and marine), 25-30% for “making things” (e.g. plastic, cement, paint, tires, all kinds of consumer goods from cosmetics to shampoo), and 10-15% for electricity generation, heating and cooling, and other uses. Nitrogen fertilizers are made directly from natural gas and without fertilizers we don’t even have food. It’s important to keep in mind that at least half of aggregate oil demand - if not likely more - comes from use cases that will continue to grow at GDP rates and/or where replacements for fossil fuel simply do not exist for the foreseeable future (e.g. “making things”, air and marine transportation).
And while alternatives such as electric vehicles are on the rise, it is important to keep in mind that the speed of demand substitution is gated by physical constraints including supply of key materials for electrification. For example, lithium prices have shot up five to ten fold since 2020 levels. The supply for these materials in many cases face supply constraints that are just as structural and serious as oil and gas, including environmental and permitting issues in mining. Another under-discussed constraint on EV penetration is the electrical grid, which will have to undergo substantial investments if it were to accommodate for the ambitious projection of EV penetration in the coming decades.
To be clear this is certainly not an argument against EVs, nor a bet against human innovation and ingenuity. Rather, it is an important realization that many things around us come from fossil fuels. It is a recognition that even as other sources of energy ramp up their supply, it will not satisfy the world’s vast energy needs. This is not about oil & gas versus renewables, even though narratives are always constructed this way. The bottom line is that we don’t see this as a zero sum game. Recognizing the massive need for energy and the coming shortfalls in the transition era, we see a way for both oil and renewables investments to do well. We are still far from a point where these things have to be mutually exclusive, and this is a point that’s perhaps underappreciated by investors.
This point will become even more clear once we start to incorporate the supply picture, which we discuss in the next section.
“We drive everywhere. We fly everywhere. We expect to be able to do that. We heat our houses. We buy cell phones, want everything to-go etc. We are consuming a lot of resources. I think people don't really have an appreciation of what it actually takes to give them the life that they have today.”
- Former Division Head, Saudi Aramco, August 2022 (Stream Transcript)

If we extend this conversation to gas then we find a few interesting nuances. Gas is very different from oil in that it is less cyclical than oil and is mainly used for producing electricity, producing fertilizers as well as for some industrial uses. Unlike oil which can be easily transported, gas requires specialized infrastructure in order to process, store and transport. For the last 10 years, the gas produced in the US has been trapped domestically which kept prices low in the US. Increasingly, with the build-out of LNG (liquification) terminals, gas is becoming an international commodity - just like oil.
With Europe’s efforts to wean itself off Russian natural gas, US LNG will become increasingly important. With Venture Global’s Plaquemines LNG and Cheniere’s Corpus Christi Stage III getting a green light, total export capacity in the U.S. will be at least 17.3 billion cubic feet per day (Bcf/d) by mid-decade. Other proposed projects can add 11.4 Bcf/d of export capacity to the U.S., pushing the total toward 30 Bcf/d by the end of the decade. Total US gas production is roughly 91 Bcf/d so this is about 30% of US production and is sure to change the supply demand dynamics on the continent.
Supply
Now this is where things get really interesting. Edward Chancellor wrote a wonderful book called ‘Capital Returns: Investing Through the Capital Cycle’ in which he shows a way to profitably invest in cyclical sectors. One of the key takeaways from the book is to look at the flow of capital. Sectors which see excessive capital inflows will produce mediocre returns, and sectors with deficient capital will eventually produce excessive returns. Think technology in 2000 and 2020, or housing in 2006 for the former, and oil & gas and metals and mining in 2002 or 2020 for the latter.
Another important insight offered by the author is that the primary driver of corporate profitability is a favorable supply side, and not necessarily strong demand growth. Yet, most investors devote more time to thinking about demand rather than supply (arguably demand forecasting is the more difficult one). It is the shifts in the supply side that stock prices often fail to anticipate. This is precisely the lesson that’s applicable to the oil and gas industry today.
With commodities, it is often said that “the cure to high prices is high prices”. Yet, even though oil prices now sit at a comfortably high level by historical standards for producers, their supply responses continues to be restrained. Let’s try to understand why this is the case. We attribute this to the following factors.
1. ESG headwind
ESG (Environmental, Social, Governance) has gained significant momentum in recent years, having been adopted by some of the world’s largest investment organizations. The movement has arguably had the most impact on the Western oil majors, such as BP and Shell, contributing to their clean energy rhetoric of recent years. BP now states its corporate purpose as “reimagining energy” and to “help the world reach net zero”. Shell’s CEO has been in public advocating for increased taxation on its own industry. These firms have distanced themselves from the oil & gas label, attempting to rebrand as the ‘next generation’ breed of energy company.
All this had the direct effect of reducing capital expenditure in the traditional sector:

We aren’t here to get into an ethical debate, but we do question why the ESG crowd never talks about the ethical side of depriving people of affordable energy. Energy lifts people out of poverty and saves lives - is access to affordable energy not a basic human right? And you would imagine in a year like this - when it couldn’t be clearer the missteps in our energy policies - that there would be some “let’s take a step back and introspect” by the key decision makers. This doesn’t seem to be happening. All within recent months:
Munich Re, the world’s largest reinsurer, stopped insuring new fossil-fuel projects, joining a green alliance. Now 43% of global reinsurance market by premiums have restricted cover for fossil fuel.
Princeton University’s $30bn endowment fund banned all listed fossil fuel holdings (caving to activism by students and faculty)
The UK is hiking a windfall tax on oil & gas companies. Beginning January 1, the Energy Profits Levy on oil and gas companies will increase from 25% to 35% and remain in place until the end of March 2028.
Ironically, all of these ESG measures have contributed to keeping oil prices high, increasing the profit for oil & gas companies.
2. Management’s reluctance to invest
Every company is producing a lot of free cash flow at current oil prices, but their focus is not on increasing production but returning this capital to shareholders. The companies which have debt are also prioritizing debt repayment.
“If you look at the rig count in the shale space, we had $90 oil last week and the rig count only went up by a dozen or so across the U.S. There's a lot more pressure on companies to return money to those investors and see some increase either in stock price or dividends.
- Former Director, Marathon Energy, December 2021 (Stream Transcript)
Management teams have been through a lot in recent years. The crashes of 2015 and 2020 have made a mockery out of the most optimistic management teams. It’s likely to take more than just a few quarters of high crude prices for management to revisit their investment plans; perhaps even a generational change is required for the mindset to change. On the other hand, investors have become reluctant to play the long game too. Why invest long-term in a business that’s popularly seen as being on the “losing side” of energy transition? Investors have figured the best way is to milk existing assets as much as they can, pressuring management to focus on returning cash.
In addition, the uncertain environment around government policy has also contributed to management’s reluctance to invest - windfall profit tax, price caps, export bans, etc. No management team would be eager to invest when the government is on the lookout for the first signs to take away any excess profit out of the industry.
3. Labor and equipment market tightness
During Covid, employees with decades of experience have left the industry - some permanently - amid demand shock and oil & gas bankruptcies.
“There's been a huge retirement wave that's been happening for quite a while and it was accelerated during the pandemic. I speak from experience. I retired from Hess just because they didn't have the work. Most of my work, I was involved in deepwater and they weren't drilling. They had to just stop in the U.S. Our entire completion team was retired. We had people with 30+ years experience and no one's coming back”
- Former Senior EHS Manager, Hess Corporation, February 2022 (Stream Transcript)
At the same time, young petroleum engineers are becoming increasingly scarce too. According to Bloomberg, this year, the number of new petroleum engineering graduates is expected to total just 400 in the United States, down more than 80% from 2017 when there were 2,300 graduates. The retirement waves and the decline in young talent going into the industry likely means the industry labor market will remain tight in the near term.

Equipment has been another area of challenge. During Covid many companies were idling their equipment and using parts from the idled equipment for the active equipment as they struggled to obtain parts. With supply chain disruptions, they have had difficulty getting equipment back to the patch in order to increase production. Some service companies are still operating at full capacity, resulting in smaller operators not getting the equipment they need in order to grow.
4. Inflation
High inflation is a big problem for the industry because it derails investment plans. Based on our own discussion with management teams (WhiteCap Resources and NuVista Energy), inflation in capex and opex has been running at about 15-20% a year. In this kind of environment, capital budgeting becomes all but an impossible task. As a result, management teams have been sitting on the sidelines waiting for inflation to subside (while raking in all time high profits).
And while capital budgets are up in 2022 by an average of 23% over 2021, keep in mind that about two-thirds (15%) resulted from oilfield service inflation.

“Chevron's CEO, its previous CEO, I remember him standing up, at that time oil was $100+ a barrel, and he said that "$100 a barrel is the new $30." What he meant by that was basically, we don't make any more money at $100 than we did at $30. It's just everything shifted because things cost a lot more. A lot of these performance gains will stay and hopefully will continue.”
- Former VP Global Wells and Seismic Delivery, BHP, March 2022 (Stream Transcript)
A closer look at US Shale
A commonly asked question is then - what about shale? US shale production has by far been the most significant source of global production additions in the last decade. According to Reuters, U.S. marginal production (+14.5 million b/d) captured nearly all the increase in global consumption (+14.8 million b/d) between 2009 and 2019. U.S. producers boosted their global share from less than 11% in 2009 to to 19% in 2019.
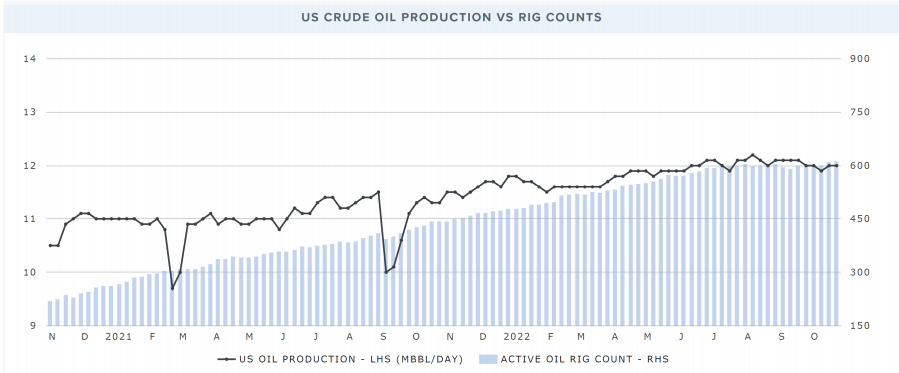
However, despite oil price being materially higher in 2022 than in 2019 (WTI at $90-100/bbl vs. $50-60), U.S. production is expected to be just up slightly compared to 2019, the last year before the pandemic. The last time WTI was at $90-100/bbl, there were more than 1,300 horizontal rigs operating in the US. Today, in a similar oil price environment, rig count is only around half of that level as shown below.

The near term trend indicates rig counts and production have flatlined since the summer.
We can break this down into several issues here.
First, it’s worth noting the DUCs (drilled but uncompleted wells). Essentially, in the prior cycle (before Covid) the shale industry over-drilled but these wells were left in place during the Covid demand shock. Drawing down on these DUCs gave the shale industry the ability to quickly ramp up production during the recovery phase. However, the industry has now exhausted most of the DUCs. Shown below, DUC drawdown has flatlined and most of whatever is remaining are most likely to be dead or uneconomical.

Second, every oil producer faces a decline rate, and shale has extremely high decline rates (conventional oil declines at an average rate of 6% annually versus shale at 30-40%). Producers therefore needs to keep drilling a significant amount of wells just to stay even on production. If they want to grow, they have to drill even more wells. One expert referred to it as a hamster wheel:
“We did quickly realize, my gosh, the spend to not only increase production but also just to maintain production is significant in the unconventional space because the production depletes so quickly and you have to keep on reinvesting, drilling more wells, fracking more wells to not only increase your production but just even to maintain it flat. We called it the hamster wheel. The free cash flow curve is always pushed a little bit out to the right because you need to reinvest your cash capital to drill more wells…I think that was pretty much how everyone was, clearly not delivering enough cash”
- Former VP Global Wells and Seismic Delivery, BHP, March 2022 (Stream Transcript)
EIA has had to consistently revise its shale production estimates downwards due to this. Shown below, the decline rates are staggeringly high - much of new production is merely offsetting the decline rather than adding to net production increases. This is caused by degradation of shale acreage quality.

Importantly, we believe that today there is significantly more supply discipline in shale, which is completely different from that of the previous Shale 1.0 era (2010-2019), which was fueled by the drilling frenzy of small players. Lenders and investors were bankrolling management teams in an era of easy money, based on assumed project economics that turned out to be pie in the sky. Then 2020 hit, and the industry was decimated, with more than 100 producers filing for bankruptcy.
Today, things are quite different. We believe Shale 2.0 has learned from the failures of 1.0. There has been industry consolidation, and large quantities of prime acreage are now owned by the large cap producers. Surviving companies have the experience operating through a full cycle, and these companies are more sophisticated operators and financially prudent. There is also no more access to cheap capital. According to Reuters, “U.S. shale industry leaders now talk about their investment and production strategy using almost identical language to Saudi Arabia and the other members of the OPEC⁺”
Strategic Petroleum Reserve
The Strategic Petroleum Reserve (SPR) is an emergency reserve of petroleum maintained by the United States Department of Energy in response to supply disruptions. Since being established in 1975, the US government has tapped into the reserve on only three occasions prior to the current crisis - during Gulf War in 1991, Hurricane Katrina in 2005, and war in Libya in 2011.

On March 31 President Biden announced the release of 1 mn barrels per day from the reserve over the next 180 days (for comparison, the United States consumes roughly 20 mn b/d and globally 100 mn b/d). An additional 20 mn barrels of release was announced in July. As of November 18th, the SPR stockpile has fallen to 390 mn barrels compared to a historical steady level of about 600-700 mn before the recent major drawdowns. We are now at a point where the SPR is turning from being a seller of oil to a buyer as it must replenish the stockpile.
In October, the White House has announced its commitment to replenish the SPR by buying back crude at a price range of $67-72. This effectively helps to form a floor price and helps incentivize new production.
OPEC and Russia
No discussion on oil is complete without a mention of OPEC. Historically OPEC had been referred to as a “call” on oil supply. This is because while producers outside of OPEC seek to operate at full capacity, OPEC maintains spare capacity that can be adjusted quickly in response to meet demand changes. However, there is a big debate currently that argues that OPEC does not have the spare capacity that they state they do, limiting its ability to increase production.
According to EIA estimates, OPEC currently has 2.5 mn b/d of spare capacity but in practical terms they have been producing below their quotas. Some analysts interpret this as a sign that OPEC has difficulty in meeting higher production levels. And over time this concern seems increasingly being validated, although the problem is that OPEC is opaque and outsiders can only speculate.
What we do know is that OPEC’s assets are quite dated - for example, Saudi Arabia’s conventional oil fields are now 50-60 years old. They have successfully extended the production for a very long period of time, but analysts argue that these fields are finally hitting the phase where decline is inevitable going forward. Saudi Arabia had 12m b/d of capacity in 2019, and has disclosed its plans to get to 13m b/d by 2027 but analysts are skeptical. Within OPEC, it is said that UAE is the only place with real spare capacity.
Russian oil is in a dire situation. It risks steep declines going forward given sanctions on Western oil equipment/technology which producers rely on, as well as the EU ban on Russian oil imports which has recently gone into efffect. The chart below shows the destination of Russian oil exports. Russia has to replace most or all of its EU-destined oil with Asian and other purchasers. Notably there is considerable logistical challenge involved in this re-routing, with Russia’s shortage of deepwater ports and the quantity of oil transport vessels required.

In summary, we have laid out the key points when it comes to understanding the evolving demand and supply picture. While this report is not about offering price predictions, one of the key jobs as an investor is to recognize when the industry fundamentals have been structurally altered. We believe such is the case today with oil & gas.
Ideas discussion
We have analyzed a myriad of oil and gas companies. They are all very similar but at the same time, very different. While they all dig for and produce oil and gas, some produce light oil, some heavy, some have a substantial portion of gas while others are pure crude. Further, growth, cost to produce, operating netbacks and reserve life can differ for companies which will result in different economics as well as different intrinsic values. We have to take all this into account when analyzing an oil and gas company. Management is also a critical factor - in hard times management should be able to get the clues from the market and be able to cut costs to the bone. In boom times, management should have a well thought out plan in order to return capital to shareholders. This is the general lens via which we look at the industry. Within that, in this report, we will highlight four companies - all of them investable with some subtle differences that will make the reader appreciate the nuances of oil and gas investing.
As we look at the industry, the common theme we find is that all oil and gas companies are awash in free cash flow. They had cut costs in the previous downturn so when oil prices started rising, a lot more of those revenues flew straight to the bottom line. With this cash flow, many companies are busy paying down the debt that they accumulated in the downturn. This is precisely Buffett’s thesis with Occidental. The company is a cash flow machine at these oil prices and is allocating a significant portion of these cash flows to debt paydown and stock buybacks. The magic of compounding means that - IF - oil prices do not collapse, you can have a company that is debt free with share count down 15-20% in 3 years. It is not hard to calculate the eventual outcome for the stock here.
Prairie Sky Royalties (PSK)
We start with Prairie Sky, which is the most all-weather idea here and one that requires the least amount of being right on future oil price to invest.
PSK has one of the largest independently-owned portfolios of fee simple mineral title in Canada, with approximately 18.2 million acres of fee lands. The business model is that operating companies can drill on PSK lands for a share of revenues produced from PSK lands. PSK does not have to spend any capex or opex for this production. PSK does, however, have to replace reserves.
PSK has different types of land holdings - some with more rights than others. PSK’s average corporate royalty rate is approximately 6.0% while standard leasing rates on Fee Lands are 17.5% for oil and 15% for natural gas. The company also receives a 5% royalty on its shallow natural gas which makes up approximately 18% of natural gas production. PSK’s GORR royalties range from approximately 1%-6%. There are a few types of royalties as shown below:

The royalty businesses are essentially a call option on land and technology. The predecessor to PSK has been in existence for many decades. Without advances in technology, a lot of this land is barren but once a method is discovered to extract oil and gas profitability a lot of this vacant land becomes productive. Here is a chart on total production from PSK lands:

For this, PSK has been active in the market and has consolidated a lot of land holdings since its IPO. All the company does is buy and hold land with rights to natural resources. Since the IPO, they have been able to almost double the amount of land they hold from 11 mn to 18.2 mn. The CEO here runs it like an old fashioned family company. Since the IPO, the company has been able to pay $1.2 bn in dividends and at the same time increase acres per share.
At current market prices of $21/s the company has a market cap of C$5 bn and a 4.55% dividend yield. The company is poised to produce $600 mn in EBITDA this year and $1.36 in EPS so any which way we look at it the company is not expensive. We should mention that the writer of this piece bought PSK at $8.5 in the summer of 2020 when oil prices went negative. This is one investment that investors can buy in their portfolios whenever there is stress in the oil environment.
MEG Energy (MEG)
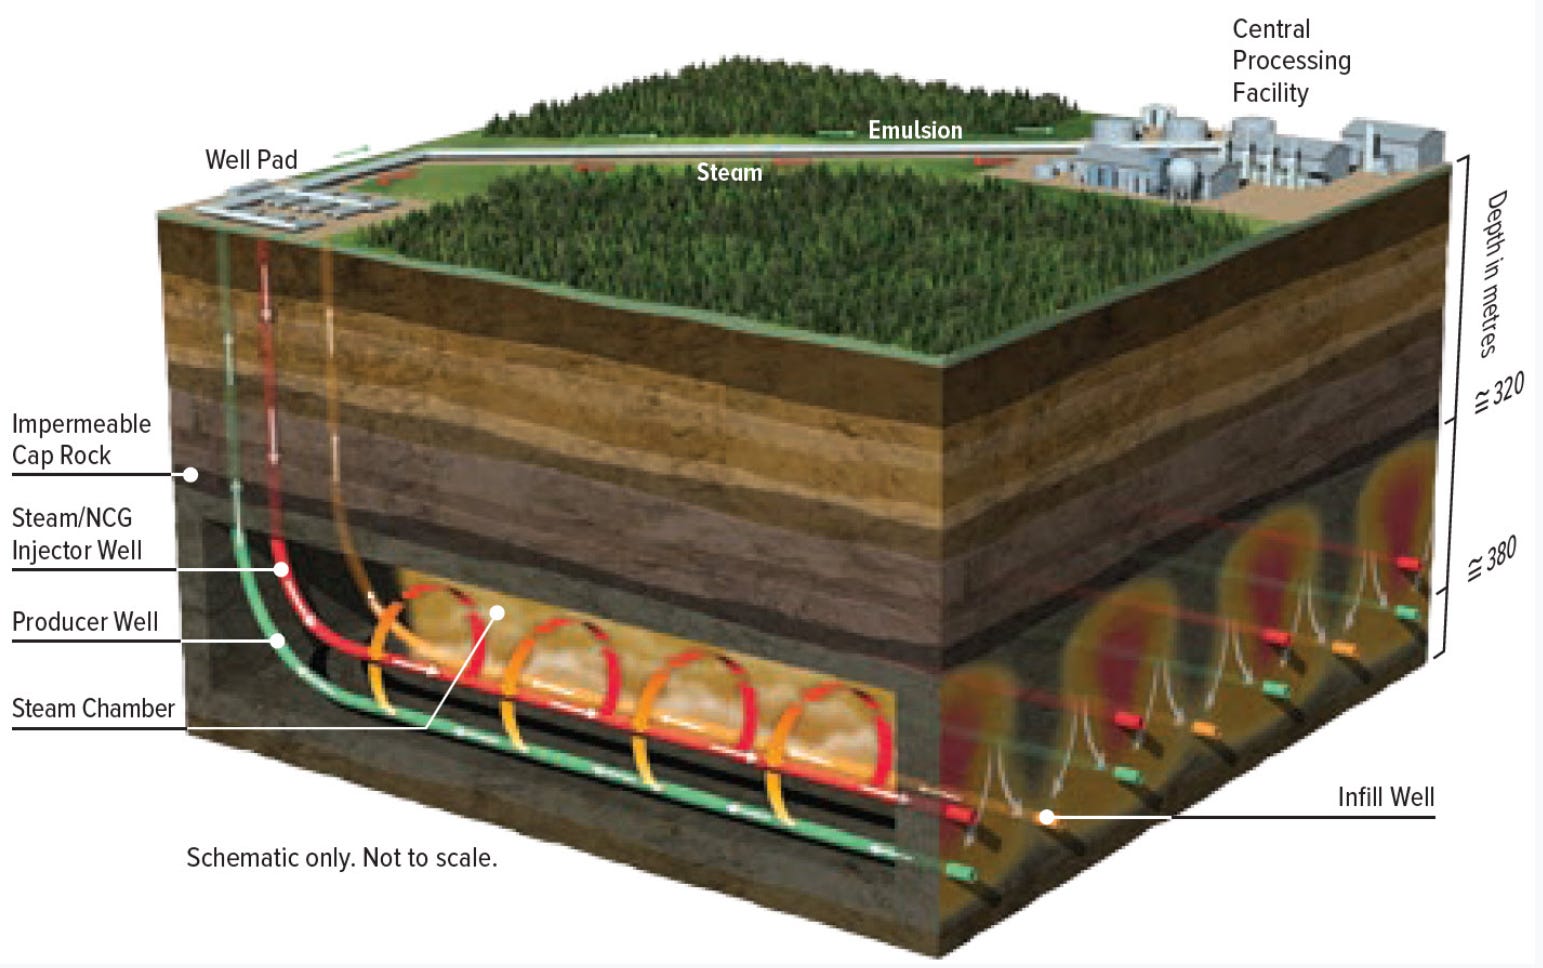
MEG has a very interesting history. It is an oil sands producer with a high quality project at Christina Lake, Alberta. When we say oil sands, the company does not mine for bitumen but produces bitumen via a SAGD process (explained later) which has much lower environmental impact compared to open pit mining. The previous management at MEG spent like ‘drunken sailors’ and loaded the company with debt in order to build the Christina Lake project and associated infrastructure. When oil prices remained low for the prolonged period of time, the company was in trouble with its equity trading at depressed valuations. The new CEO took MEG from a capital spending machine to a sustainable company. The asset here is top notch. In fact, in 2019, Husky energy made a bid on MEG at an EV of $6.4 bn.
The oil sands, also known as tar sands or bituminous sands, are a type of unconventional petroleum deposit found in northern Alberta, Canada and other countries. These deposits consist of a mixture of sand, clay, water, and a thick, heavy oil called bitumen. Extracting and processing the oil from the sands is a complex and energy-intensive process that involves mining the sand, separating the bitumen from the other materials, and then upgrading it to produce synthetic crude oil. SAGD, which stands for Steam-Assisted Gravity Drainage, is a method of extracting heavy oil or bitumen from oil sands deposits. It is a type of in-situ extraction, which means that the oil is produced from the ground without having to be mined. The SAGD process involves injecting steam into a well that is drilled into the oil sands deposit. The heat from the steam melts the bitumen, which is then pumped to the surface through a second well. The bitumen is then separated from the water and other materials and processed into synthetic crude oil. The efficiency here is measured by steam to oil ratio and MEG has one of the best ratios here of 2.4:1 and has continuously worked to reduce it.

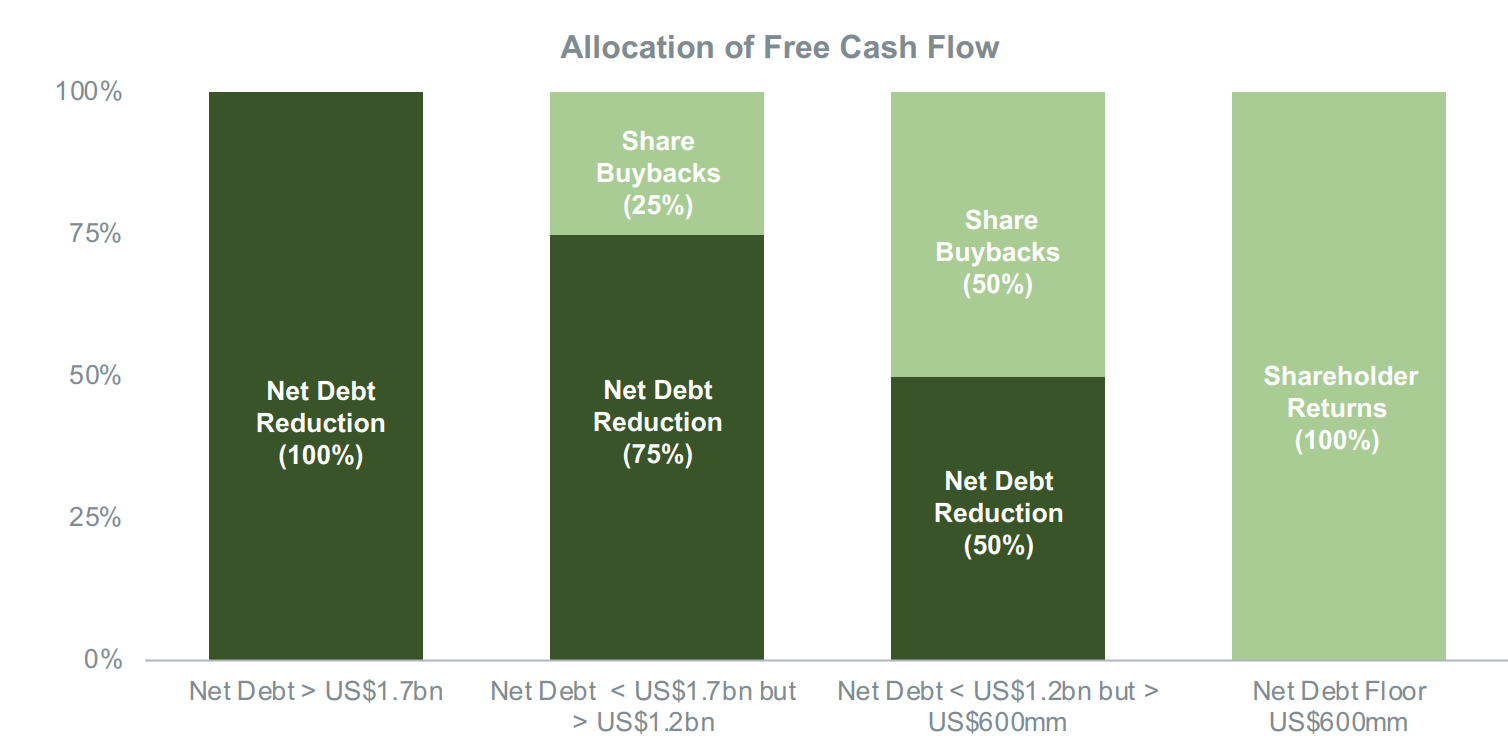
At its Christina lake project, MEG produces about 100K boe/d and they have approvals to go up to 210k boe/d. In the near term, the plan seems to be to get to 120K boe/d with some debottlenecking which will cost about $25k/flowing barrel - so MEG can add 20K boe/d for $400-500 mn. This is all theoretical as they would not do it without reducing their debt first. With its cash flow, MEG has the following plan:
The company is trading at 4x FCF and has $5 bn in tax assets that make it very attractive to an acquirer. The other part that is attractive to another company is the fact that Christina Lake is a low risk, stable cash flowing asset that will fit nicely into a larger company. In fact, Cenovus has projects very close to Christina Lake and has been seen as a natural acquirer.
While we were writing on MEG, we came across this report which we believe goes in depth and covers MEG very well:
White Cap Resources (WCP)
White Cap is a very different type of a company - a high risk high reward acquirer of properties. It drills for light oil in the Montney and Duverney regions of Canada where the product mix has about 25-30% gas. The company recently acquired XTO from Imperial oil due to which is in the ‘penalty’ box. However, this asset was purchased by Imperial and Exxon in 2012 for $3.1 bn at that time when it had 16K boe/d in production and over the last 10 years, they sunk $1 bn into the assets. Today, WCP is buying at $1.8 bn for 37K boe/d with long life inventory. They did not issue any shares and bought for debt. With this acquisition, WCP has increased its growth, upgraded its portfolio, and increased the life of its reserves. Management has aggressive plans to pay back debt and then return cash to shareholders.
It is interesting to note that unlike the oil sands, this is a very different oil asset. Within Montney the decline is 38% - meaning a well that one drills today only produces at about 60% of its original production in year two. WCP has a 25% decline rate from a corporate perspective so they have to drill these wells every year in order to maintain their production flat. In order to grow, they have to drill even more wells. With long life inventory, this is increasingly possible.
Of course if oil prices are not very strong, then WCP is at a higher risk compared to PSK or MEG, as it has debt to pay down. It becomes difficult to do this at lower and lower crude prices. The company is currently trading at a very cheap valuation or 4x FCF and has a 4% dividend yield. We note that they have identified some non-core assets for sale, which, when sold will act as a little bit of a catalyst for the company.
Transocean (RIG)
Transocean is the world’s largest offshore drilling contractor and the technology leader. The company is focused on the most high-end and technically demanding segments of offshore. Over the years it has transformed and renewed its fleet to focus only on ultra-deep water (UDW) drillships and semi-submersible for harsh climate (mainly in the North Sea), with average fleet age of only 11 years. It has a market share of 15% and 25% respectively in these two categories, but the company has even higher share in the highest spec areas, including the only two drillships in the world equipped with 20k psi well control systems - Deepwater Atlas and the Deepwater Titan (necessary for maintaining production in regions like Gulf of Mexico where there is need to go deeper)

A bet on Transocean is a bet on the offshore capex cycle. A combination of declining reserve life (increasing production but not enough exploration) and energy security concerns are leading to renewed interest in offshore investments by state-owned producers (see Equinor in the North Sea even as it simultaneously pursues renewables). Supermajors like Exxon have also renewed their focus on offshore seeing the limitations to pursuing shale. Despite high initial costs, offshore operates with lower marginal cost and decline rate over time which means it will likely be more economical relative to onshore in a persistent inflationary environment.
The supply for rigs has fallen as shipyards have halted their production. Improving supply and demand has led to day rates roughly doubling in the last two years. Transocean operates a fleet of 39 floaters, out of which 26 are currently contracted to customers and operating (66% utilization). Compared to most peers which are seeing 70-80% range, Transocean has lower utilization but this also means it is the most torqued player to an offshore capex recovery.


Above shows the company’s EBITDA and cash flow generation under different day rate scenarios. There is a lot of operating leverage as incremental day rates mostly flow directly to the bottom line.
The company has $20b in assets, $9b in liabilities, and $11b of equity, with market cap of less than $3b. There is also reason to believe the value of assets are materially understated as the replacement cost for the drillships today would be much higher due to inflation and the shipyard supply capacity.
To calculate a “fair value”, one can take the replacement value of assets (at least $20b), add the present value of order backlog ($7.3b as of November) and deduct debt ($7.2b) from this. The bottom line is that any valuation approach will take you to a deep value (or distressed) territory. For those with the risk appetite this opportunity can be regarded as a cheap out of the money call option on oil price and the offshore capex cycle.
Transocean also has the industry’s most disciplined management team, having come of out the Covid downturn as the only major drilling operator that didn’t file for bankruptcy. There’s also been some insider buys this year, notably the Chairman who bought 50k shares at $4.07 in early November.
Disclosure: the authors and their firms own one or more of the above positions mentioned. We may be wrong in our assumptions so we encourage all readers to come to their own conclusions.

Stream by AlphaSense is an expert transcript library that helps investment analysts maximize returns with access to tens of thousands of high-quality, searchable, proprietary expert transcripts covering nearly every industry and market. Unlike costly and time-consuming traditional expert network calls, Stream drives faster time to insight, improves ROI, and ensures critical information isn’t missed in the research process. You can sign up for a free trial by clicking here.
This was a great piece. Thank you!
Very interesting post. How do you see the role of prepay, rehypothecation, and the use of commodities as collateral in the futures/derivatives market when it comes to the oil market?