
Deep Dive: Dollar Tree (DLTR) - Part 2
Putting it together: management, valuation, DLTR vs. DG, and tactical considerations

Welcome back!
In this second part of our deep dive on Dollar Tree (see Part 1), we cover:
The turnaround at Family Dollar
In-depth examination of CEO Rick Dreiling’s track record and why he’s the ideal catalyst for turnaround
Valuation - assumptions, forecast, and return profile
Discussion of risks including understanding the impact of Temu
Comparison with Dollar General: why we see DLTR - not DG - as the more compelling investment opportunity today.
Tactical considerations
And more
Detailed models are included in the appendices and are available for download at the end of the report.
Family Dollar: Executing on Retail Fundamentals to Narrow the DG Margin Gap

Context: Founded 3 years after Dollar General, FD was once the largest dollar store operator in the US by store count. Issues began to emerge in the late 90s/early 2000s when Founder/CEO Leon Levin retired and was succeeded by his son Howard. DG surpassed FD shortly thereafter and KKR’s 2007 LBO (overseen by Rick Dreiling) further widened the gap in their growth and profitability trajectories. Since then, various management teams have been trying (in vain) to close the gap (see below).

As discussed, the primary drivers of Family Dollar’s malaise have been (1) band-aid solutions and gross margin-driven decision making which have led to uncompetitive prices and merchandise that is often mis-aligned with core customer needs and (2) underinvestment.
While the FD turnaround is a tall order, the odds of success have never been higher; Rick Dreiling has intimate knowledge of Dollar General (CEO from 2008-2016) and has recruited DG’s former Chief Merchandising Officer, Chief Supply Chain Officer, and Chief Information Officer to execute. While the gap is wide, there is considerable low-hanging fruit and significant value can be created by simply executing on retail basics to narrow the gap. Management is targeting a 5% EBIT margin (before central costs) in FY26 (v 8% at DG). The market is clearly skeptical, but since Dreiling & Co went to work in Q2/22, there have been notable inflections in traffic and comps (see above).
Dreiling’s diagnosis: “There’s structurally no difference between the 2 banners, Family Dollar and our #1 competitor… our team’s experience gives us the opportunity to complete in just 3 to 5 years what has taken far longer in other situations… it’s all fixable, and we know how to fix it…as we narrow the gap operationally, it will be realized in material improvements to our financial performance.”
Dreiling’s prescription: (1) drive sales productivity: “Retail is all about growing units, growing transactions, and growing sales per square foot. When these retail fundamentals move in the right direction, everything else follows.” (2) invest in people and stores (SG&A + capex) to improve store operations and the customer experience.
Key Initiatives at Family Dollar
Price investments: Beginning in July 2022 (late in Q2), after ~1 quarter in the seat, Dreiling cut prices 4-5% to restore price parity with DG for the first time in over a decade. The chart below details prices of “known value items” (top 700 items/traffic drivers) and the full book of merchandise relative to Dollar General. The impact was felt immediately: (1) traffic inflected (positive for the first time in 3 years) and has increased steadily since and (2) average basket has increased 2% despite the price cut; by Q1/23, FD was gaining both unit and dollar share at an accelerating rate (see below).

Merchandising (expanded/improved assortment): behind price, assortment is the #2 purchase consideration for FD customers and prior management’s decisions led to an assortment that was often misaligned with customer needs. To address this, management has begun:
Discontinuing larger pack sizes, which take up space and turn slowly;
Localizing planograms and assortments based on local demographics (for example, FD now have >350 pet food configurations that vary based on local cat/dog population and large/small bag demand dynamics);
Re-designing planograms for improved adjacency flow to expand basket size; and
Re-launching private label brands and expanding private label SKUs with a focus on quality (customers love a deal but can’t afford a dud) to offer national-brand quality products at lower prices. By FYE 2026, management is targeting 20% private label penetration compared to 13% today (see below for more details).
Net-net, FD will sell 900 net-new SKUs (+12%) designed to increase traffic and expand the basket by enabling consumers to complete their list in a single trip. The merchandising reset (notwithstanding further private label SKU expansion which will continue through 2026) is set to be complete by November 2023. Early results are encouraging; increasing SKU count in condiments by 20% is driving a 20% LFL comp post-reset and, similarly, increasing SKU count in dental by 11% is driving 11% LFL comp post-reset. To support the expansion of SKUs and categories, shelf height is being increased from 72” to 78” (effectively increasing selling space by 4-5% at little cost) and 16k cooler doors are being added in 2023 alone (2 per store).
Private label benefits: Each 100bps of incremental penetration is worth ~14bps to gross margin, driving a 100bps tailwind through FY26. New private label SKUs will hit shelves in H2, and the selection will continue to expand through 2026.
Format optimization: Despite years of failed attempts, former management was unable to develop a winning format to rollout across the entire fleet via renovation, which led to meagre new store opening and thousands of stores that hadn’t been touched in decades. Current management believed they have cracked the code by developing 3 separate formats optimized for different locations/real estate opportunities: H2.5 (upgraded from H2.0 from prior management) as the core format, supported by Combo Stores (FD + DT) in rural areas and XSB (extra-small box) in urban areas (see table below for initial uplifts).
These formats will be deployed in both new store openings and renovations; management is targeting >1k renovations per year through 2026 at which point the entire fleet will be within management’s 5-7 year useful life window. XSB is particularly important as most of the >2k stores that haven’t been renovated in over a decade are in urban areas, where competitive dynamics are evolving in favor of small box retailers (ex. food deserts). As COO Michael Creedon explains, “when you can get below 6,700 square feet, there’s a lot more real estate that becomes viable in urban markets”. Format optimization will also facilitate accelerated store growth (net new stores targeted to increase from LSD to MSD by 2026), which will address the ~50% of low-income households that don’t currently have a FD store in their ZIP.
In addition to the urban opportunity, a former Regional VP of Operations at Family Dollar explains why the rural combo format can move the needle:
“The combo store, that is by far the best thing that Family Dollar, Dollar Tree has done since the merger….She can come in and hunt and pack and go to the treasure hunt on one side, and then she can pick up the stuff that she knows she needs. It's a different type of shopping experience, and the basket is bigger, plain and simple…I would do it in the rural areas because a lot of them, you have the same base of customers. If you can combine efforts, it just makes so much sense… I just remember the two I had [in my region]. One was up over 100% and one was in the high 80%s in sales lift… there’s tons of real estate out there from CVS and Walgreens closed locations that are 15,000-16,000sqft. There is an opportunity for them to scale quickly if they decide that’s the route.”
- February 2023, Stream Transcript
Early results: at the June CMD, management revealed that Family Dollar has added >2 million customers over the LTM (+3%). In conjunction with a near-instant inflection in traffic and sales following the price cut and SG&A investments despite little marketing/promotion, these data points demonstrate the banner’s significant untapped potential.
Similar to DT, these initiatives at FD will provide years of comp tailwinds vis-à-vis improved/expanded assortment, private label penetration and renovations while allowing for accelerated store growth due to format optimization. This all sounds good, but so do many retail turnaround plans that ultimately end in tears. What makes this opportunity so attractive is the track record of Chairman & CEO Rick Dreiling…
ELITE MANAGEMENT: RICK DREILING’S EXPERIENCE AND TRACK RECORD ARE IDEALLY SUITED TO DLTR
Generally, retail turnarounds are difficult to execute and have low success rates, so why bet on Dollar Tree?
Rick Dreiling’s track record is pristine and highly relevant – not only did he execute the (wildly successful) turnaround of Dollar General, but his successes at Longs Drug Stores, Duane Reade, and Lowe’s demonstrate a track record across both urban/rural markets and small/large boxes
Dreiling is aligned: his compensation (aside from $1mm in annual salary) is 100% stock options (to buy 2.3mm shares with a strike price of ~$150 expiring March 2027).
In concert with Mantle Ridge, management has consistently repurchased shares below quarterly averages based on a “strong view” of intrinsic value; combined with an under-levered balance sheet (~1.5x net debt/EBIT or ~2.0x total debt/EBITDAR) this capital allocation acumen will amplify value creation.
The Track Record
Longs Drug Stores (COO from 2003-2006)
Dreiling joined Longs after 33 years at Safeway where he held various executive positions in marketing, manufacturing and distribution. During his time at Longs the operating margin improved from 2.0% to 3.5% resulting in EPS growing from 83c/share to $1.98/share (34%pa) which drove a doubling of the share price (~25% IRR).
According to BB&T retail Analyst Andrew Wolf “he did many of the same things he had done at Safeway — a lot of very nuts-and-bolts operational-oriented activities, like labor management, distribution, merchandising — a pretty broad swath of activities”. Key projects included centralizing distribution and buying, reducing shrink, optimizing labor and installing systems (distribution, warehouse management). In August 12, 2008 Longs was acquired by CVS for $71.50/share compared to a price of ~$15 when Dreiling joined in 2003 (5-year IRR of ~35% IRR).
Duane Reade (CEO from 2006-2008)
Dreiling joined Duane Reade in late 2005 as the fiscal year was wrapping up. The company reported SSSG of 1.9% and an adjusted EBITDA margin of 1.3%. Over the next 2 years SSSG improved to 4.6% and 7.4% respectively, driving sales productivity from $862/sqft to $975/sqft (+13%) and EBITDA margins to 3.8% for total EBITDA growth of ~187%.
This was achieved by investing in stores and leaning into the convenience aspect of the value proposition. Key projects included: (1) store operations (décor/fixtures, service), (2) merchandising (tweaked assortment towards convenience, ready-to-go food), (3) shrink reduction (retrained managers, heightened security, moved select SKUs behind displays). In 2010, Duane Reade was acquired by Walgreens for $1.1bn ($618mm in equity value) providing Oak Hill with a 6-year IRR of 17% (excluding any dividends) on its $245mm equity check written in 2004.
Dollar General (CEO & Chairman from 2008-2016)
Dreiling was recruited to Dollar General in January 2008 following KKR’s $7.2bn LBO of DG ($2.5bn equity check). At the time, JP Morgan Analyst Carla Casella described the challenge ahead in the context of Duane Reade: “I think DG has a lot of the same challenges. The stores don’t always look that great, and they are not consistent”. Dreiling recruited a stable of executives including Todd Vasos who succeeding Dreiling as COO at Longs and CEO at Dollar General (retired November 2022).
Key projects included: (1) stores – renovations to improve look/feel, implementation of new store standards and operating procedures, revamped planograms with improved adjacency flow (2) merchandising – eliminated >1k slower-turning SKUs to drive negotiating leverage and simplify stocking, revamped and expanded private label portfolio, (3) shrink – added CCTV to stores, moved high-shrink items behind registers and posted cashier shrink score cards in break rooms which led to 20% decline, (4) real estate – closed 400 underperforming stores and shifted from low rent to EBIT optimization-based targeting, (5) IT – upgraded systems for pricing, forecasting, and site selection (software-driven system Claritas). The results are summarized in the table below and speak for themselves. When Dreiling officially relinquished the CEO seat on June 3, 2015 the company’s market cap was $22.6bn implying an 8-year IRR of 32% excluding dividends.

Lowe’s (Chairman from 2018-2021)
Dreiling joined the board of Lowe’s in 2012 but in 2018, under pressure from DE Shaw, Lowe’s CEO Robert Niblock retired and was replaced by a “player coach” combination of Dreiling and Marvin Ellison (previously CEO of JC Penny and senior store executive at HD and Target).
Key projects included: (1) management – eliminated roles, created new roles and replaced most senior executives (CFO, CIO, EVPs of Stores, Merchandising and Supply Chain), (2) IT infrastructure and analytics – step-up in investment and (3) optimizing the store network, primarily by closing under-performing locations. These changes led to increased sales productivity ($332/sqft to $469/sqft in 4 years) which drove 400bps of EBITA margin improvement driven by gross margin (+100bps) and SG&A leverage (+300bps). Since Dreiling/Ellison took the reins at Lowe’s, the share price has compounded at ~16%pa (+dividends) compared to ~9% for Home Depot. Dreiling resumed his standard directorship in June 2021, stepping aside for Ellison to assume the Chairman role, and remains on the board today.

Recurring Themes: there are several recurring themes across Dreiling-led turnarounds applicable to Dollar Tree:
Store operations – at Duane Reade and DG stores were renovated/updated, employees and managers were retrained, and shrink was reduced with new systems and processes;
Merchandising – at Duane Reade and DG specifically, merchandise was tweaked to better-align with the needs of core customers;
IT – at Longs, DG and Lowe’s investments were made in IT infrastructure and software/systems to improve operations and provide analytics inform better/faster decision making; and
Supporting cast – at DG and Lowe’s, more than half of the c-suite was replaced by executives from industry leaders and/or prior management teams.
The Supporting Cast
Consistent with previous turnarounds Dreiling has cleaned house at Dollar Tree, replacing 14 of 16 senior executives listed on the company’s website. Notable recruits include:
Larry Gatta – Chief Merchandising Officer for Family Dollar (former SVP, Merchandise at Dollar General from 2011-2022)
Mike Kindly – Chief Supply Chain Officer (former EVP, Global Supply Chain at Dollar general from 2008-2021)
Bobby Aflatooni – CIO (former VP of IT and Supply Chain at Dollar General from 2009-2018)
Michael Creedon – COO (former President, US Stores at Advance Auto from 2017-2022)
Jeff Davis – CFO (former EVP & CFO at Walmart US Stores from 2006-2015 and more recently Qurate from 2018-2022)
Capital Allocation Acumen: Disciplined Buybacks
Many executives talk about disciplined/opportunistic buybacks, but few deliver. The chart below demonstrates both discipline and management’s belief that the shares provide an attractive return at ~$140/share. Admittedly, the biggest test is yet to come as shares are now ~$108 and capex is ramping, but leverage is comfortably below target levels of 2.5-3.0x total debt/EBITDAR (~2.0x). Management highlighted the opportunity for accelerated capital return at June’s CMD with the slide below.


VALUATION: KEY ASSUMPTIONS, FORECAST & RETURN PROFILE

The following is a list of key assumptions used in the valuation (See Appendix C for detailed models for the base and bear cases):
Store growth (~3.7%pa): as discussed in Part 1, Dollar Tree and Dollar General estimate there is capacity for between 50-55k dollar stores in the US compared to 36k today. Dollar Tree will add ~500 stores this year and “want to get to a point where we’re opening 1,000 new stores per year”, but this target is not a hard commitment and the forecast ramps from 500 to 800 by FY26. With DG opening ~1k stores per year, runway at 1.5-2.0kpa is ~8-13 years. Notably, while at DG Dreiling revamped the store opening process by focusing on EBIT-maximization versus rent minimization and implementing software to identify attractive locations. By all accounts, Dollar Tree’s process is archaic and would benefit from such an approach.
Store growth (DT – 3.5%/4.0%/4.5%): store expansion at DT slowed with COVID and nearly ground to a halt in 2022 as management focused on multi-price implementation and store operations. In the 5 years prior (2015-2019) store growth averaged 7%pa. Management plans to re-accelerate net new store growth to MSD (4-6%) over the forecast period, commenting “we are going to own suburbia”. Long-term there is some circularity with respect to store runway and economics; the greater the success of multi-price, the greater the opportunity set of viable real estate opportunities.
Store growth (FD – 2.5%/3.5%/4.5%): FD’s store count has been net flat since 2018 due to closures and attempts to optimize the box before expanding. Recent inflection in sales and development of 3 distinct formats optimized for different location types set the stage for acceleration. FD’s extra-small box format is designed to capitalize on urban opportunities where markets are becoming less competitive due to food deserts. Paradoxically, urban markets are becoming increasingly like rural markets in that they provide opportunities for local quasi-monopolies due to a lack of viable alternatives within walking distance (as opposed to driving distance).
Regarding FD, the achievability of this growth is supported by below:
“As far as the business model goes, there’s a ton of growth. It wouldn’t surprise me if they doubled store count. There’s lots of opportunity where those stores could move to and with their newer models, which they were still early in when I left the company last year. Incorporating the Dollar Tree merchandise into the stores has showed huge growth so there’s a lot of additional opportunity coming.”
- Former District Manager at FD (January 2022, Stream Transcript)
SSSG (DT – 4.5%pa): following DT’s investment in cooler doors in 2006, SSSG averaged ~5% over the following 7 years; I expect a similar benefit over the coming years on the back of multi-price. Per the analysis above, household products, health & beauty and frozen food alone can provide an annual comp tailwind of 4-9%pa by achieving market share 25-50% below current share in the <$2 space. Additionally, the $3/$5 price points dramatically expand the aperture for DT buyers in discretionary which will drive a material improvement in assortment over time, boosting sales (in relevant stores, seasonal comps are outperforming non-converted by stores by 8-10%). Finally, it’s worth noting that YTD SSSG of ~6% reflects multi-price penetration of just ~40% of stores. Net, 4.5%pa is likely to prove conservative.
SSSG (FD – 4.5%pa): since management cut prices 4-5% in late Q2/22, SSSG has averaged ~6% at FDO with traffic steadily improving. While those gains will begin to be lapped in Q3/23, momentum will be sustained by 3 distinct formats and related renovations (>1k/year) yielding high-teens comp gains in addition to more SKUs and categories (yielding DD+ comp gains) and increased private label penetration (new SKUs and brand architecture hitting shelves in H2/23). Further, as investment in store operations and distribution begin to take hold, FD will benefit from on-time open/close (+150bps) and improved in-stock positions (which were notoriously poor until recently, but still have room for improvement. Lastly, over Dreiling’s first 5 years at DG comp growth averaged 7%pa. While DT is more likely to surprise to the upside, 4.5% SSSG at FD over FY24-26 is conservative.
Gross margin (DT – 36.5%): key drivers of gross margin at DT are: (1) mix – discretionary items ~50% (2x consumables), (2) rent – Dollar Tree flows a significant portion of lease expenses through COGS, (3) freight – DT import 40-42% of merchandise primarily via trans-pacific shipping, (4) multi-price penetration.
Mix (headwind): over the past 6 years, consumables mix has averaged ~48% at DT, compared to 45-46% over the past 3. By 2026, consumables will likely return to 48-50% of the mix driven by improved/expanded selection and multi-price.
Rent (tailwind): improving sales and gross profit productivity will drive leverage on (largely) fixed rental rates.
Freight (tailwind): following the tightening of trans-pacific freight supply and subsequent surge in rates in 2021, Dollar Tree signed multi-year contracts at elevated rates to secure supply. Those begin to roll-off and flow through the financials in H2/23 and continue through 2024. Management has estimated a $1/share tailwind in 2023 and 2024, equating to ~$580mm of COGS relief by FY25. Adjusting 2023 numbers to reflect DT’s share of that (~80%) yields 2023 GM% of ~38%.
Multi-price (headwind): While Dollarama’s multi-price rollout led gross margins to expand by 360bps over the first 5 years, US retail is more competitive meaning a lower mark-up required to deliver the “wow factor”. In addition, at $3/$5 there will be more SKU overlap with other retailers which also limits the mark-up. Even absent overlap, Rick Dreiling’s previous engagements demonstrate he is focused on driving profit growth through sales productivity, not higher gross margins; lower prices and gross margins drive more durable growth via more frequent visits and larger baskets.
Net: assume 36.5%, the midpoint of the outlook, to be conservative (v 38% in FY23 including freight benefit)
Gross margin (FD – 27.5%): key drivers of gross margin at FD are the same as DT, but with private label in place of multi-price.
Mix (tailwind): FD’s long-term consumables mix has been ~75% compared to 80% YTD. Over the coming years, consumables mix is expected to revert to 75-77%. Each 1% change in mix is worth ~25bps of gross margin, implying a tailwind of 75-125bps through FY26 as mix normalizes.
Rent (tailwind): same as above – sales productivity gains drive leverage on rent
Freight (tailwind): while FD is not as sensitive as DT, the banner imports 15-17% of its merchandise and the anticipated savings that will accrue to FD (20%) would yield a FY23 gross margin of ~25.8% (+80bps)
Private label (tailwind): FD plan to drive private label penetration from 13% to 20% and each 100bps is worth ~14bps of gross margin, delivering a 96bps tailwind through FY26.
Vendor terms (tailwind): strong absolute growth combined with share gains position FD to earn incremental rebates from vendors, supporting gross margin gains and a narrowing of their procurement disadvantage versus DG.
Net: assume 27.5% driven by 176bps from private label/freight and 74bps combined from mix, rent leverage and improved vendor terms.
SG&A: following a forecasted increase of 15% in FY23 (versus management guidance for “low-teens”), SG&A is forecast to grow at an average rate of 6% from 24-26 (versus mid-single digits, defined as 4-6%, per management). SG&A is forecast at/above guided levels for conservatism as cost overruns are a key risk given the number of projects underway and ongoing inflation (particularly in payroll, which is the majority of SG&A ex. D&A). While LSD SG&A/sqft growth appears aggressive in light of recent step-ups, our base case is well within long-term averages pre-COVID.
SG&A/sqft (DT – 3%pa): following a step-up from ~flat SG&A/sqft growth at DT to 6% and 12% in ‘22 and ‘23, respectively, 3%pa is forecast through FY26 to capture the continued rollout of multi-price and incremental D&A from investments.
SG&A/sqft (FD – 2%pa): management have stepped up SG&A/sqft at FD twice in just over a year in charge with 12% and 9% growth in 22 and 23, respectively, which suggests a lot of the heavy lifting has already been done. This is supported by comments on the Q2/23 call that FD margins will benefit in H2 from the lapping of those investments, suggesting Q2 is approaching run-rate.
SG&A/sqft (Central Costs – 5%pa): after growing at 22% and 19% in ’22 and ’23, respectively, central cost growth per square foot is forecast to remain elevated as investment in supply chain and IT continue to ramp (albeit off a higher base).
Net: SG&A/sqft is forecast to grow 3%pa on average over the forecast period, versus the 1-2%pa implied by management.

Tax rate: forecast at 24%, in-line with estimates for FY23 and consistent with normalized tax rate per filings.
Capex: following an investment cycle which has seen capex/sales increase from 4.0-4.5% to 6.5-7.0% “before moderating in 2026 to what we believe will be more efficient levels post-2026”. FY26 capex guidance of ~$2.0bn implies ~5.5% of sales and could drop further post-FY26, but that will depend on the cadence of store growth (among other things). This is important to consider in contemplating the FCF growth profile from 2026 given impacts on buybacks and the exit multiple.
Buybacks: critically, management’s FY26 EPS target of >$10 does not include buybacks. Yet, buybacks are a virtual certainty; both Mantle Ridge (average cost $105/share) and Rick Dreiling (~$150/share strike price on options package) are heavily incentivized to allocate capital effectively and have indicated they have a “strong view” of intrinsic value. Based on LTM repurchase activity, they clearly believe the shares yield an attractive return at ~$140/share. The forecast assumes all FCF is deployed on buybacks at ~18x EPS and net leverage is increased to 2.5x, whereas management highlighted 2.5-3.0x EBITDAR is how it thinks about target leverage (with the condition that a BBB rating is maintained), implying up to $12bn available for buybacks (including FCF) versus the ~$8bn forecast.
Return Profile
Note: pro forma EPS figures use forecast year-end share count (versus average share count per GAAP accounting).
The forecast (below) yields FY26 EPS of ~$10.75 and FCFPS of ~$7.45, or $12.75 and ~$8.50 with buybacks, respectively. Over the past 10 years, DG and DLTR have traded in a near-identical NTM P/E range of 13-25x, averaging ~19x. NTM P/FCF has averaged 23-25x over the same period. The sensitivity tables below show prospective IRRs on FY26 EPS and FCFPS with and without buybacks based on a range of terminal multiples and dates (estimated reporting dates), yielding a target price range of ~$185-$230/share at 18x EPS and 23x FCF FY26 estimates for ~3-year IRR range of ~18-30%. Target price: $200/share (~18.5x 2026E EPS), 3-year IRR ~24%.
Is FY26 the end of the road? No – there are several factors that support continued premium EPS/FCFPS growth:
Declining capital intensity following the investment cycle; rolling FY26 growth/profit assumptions forward while reducing capex to 5% of sales yields EPS of ~$12 (+12%) and FCFPS of ~$9.50 (+26%) before buybacks.
Several projects, especially in IT and supply chain, will still be ramping in FY26 and yet to deliver their run-rate efficiencies, providing runway for gains and operating leverage.
New store growth, especially at FD, is expected to ramp through the forecast period (LSD-MSD) and will support a higher multiple as investors discount more stores with better economics.
Only at the conclusion of FY26 will (a) multi-price be implemented across the entire DT fleet and (b) renovations be completed across the entire FD fleet, both of which will provide a multi-year comp tailwind.

The bear case (3-year): key assumptions: (1) SSSG is reduced from 4.5% to 4.0% for both banners, (2), gross margins at both banners are reduced to the low-end of their target ranges (35.5% for DT and 26% for FDO) from 36.5% and 27.5%. (3) SG&A/sqft growth is increased to 4%pa at DT and 3%pa at FD (from 3% and 2%), (4) central costs/sqft growth remains at 5% throughout the forecast period (from 5% declining to 4% by FY26), (5) capex/sales is increased to 6% in FY26 (from 5.5%). The net result is FY26 EPS/FCFPS estimates of ~$7.70/~$3.70 (~$8.60/~$3.90 with buybacks) and a target price range of ~$92-$96/share on FCFPS and ~$138-155/share on EPS with and without buybacks (~15% total downside).
Short-term bear case: over the next 6-12 months, shares could trade down to their 10-year trough multiple of 13x NTM EPS on ~$6.50-$7.00 for a range of ~$85-$91/share or 15-20% downside.
Relative valuation: for a breakdown of current multiples based on consensus estimates for DLTR and DG, see Appendix D.
TACTICAL CONSIDERATIONS
Why does the opportunity exist?
Retail turnarounds are hard
The list of failed retail turnarounds (and bankruptcies) is much longer than the list of successes. Understandably, investors don’t want the brain damage and seemingly poor odds success/returns that come with them. However, the odds of success improve dramatically when two conditions exist: (1) credible/experienced management and (2) a durable, differentiated concept. Dollar Tree has both and the DT banner’s multi-price transition provides material upside optionality. While it is fair to say that FD is not sufficiently differentiated versus DG, Dreiling’s intimate knowledge of DG and what needs to be done to narrow the gap (which is all that’s required to move the needle) can unlock significant value.
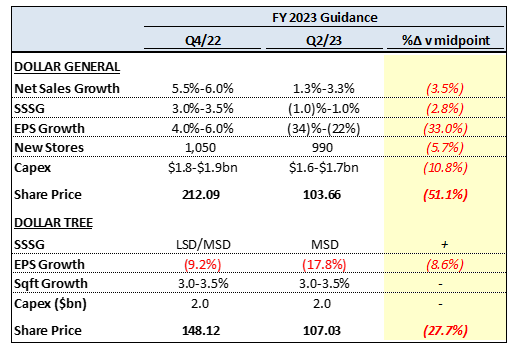
Investors are (incorrectly) extrapolating Dollar General’s issues to Dollar Tree
Dollar General has revised its FY23 EPS guidance down by 33% since providing initial guidance in March and guided for its first annual SSSG decline (ex. COVID) in 34 years. Management cited a strained <$35k consumer (exhaustion of COVID-banked savings, inflation, higher fuel prices, reduced benefits), lack of trade-down from higher-income consumers, negative mix shift, and shrink.
With these reports coming from the industry bellwether, investors have extrapolated these issues to DLTR sending shares down ~28% or 3x YTD guidance revisions versus ~51% and ~1.5x for DG. While mix shift and elevated shrink have also led to a negative guidance revision at DLTR, that is where the similarities end. Dollar Tree has reported MSD/HSD traffic increases (v MSD/HSD declines at DG), upgraded its SSSG outlook, and called out trade-down of the >$80k consumer beginning in Q4/22; it seems that Dollar Tree (FD) is contributing to DG’s issues. Seemingly tongue-in-cheek, Dreiling commented on the Q2/23 call:
“it appears that the trade down from higher income customers is coming more in the urban environment than in the rural environment” (referring to FD’s urban skew).
To combat declines, DG is marking down discretionary items (blankets, candles, picture frames), reducing prices on <1% of SKUs, and investing in labor/store operations which management claim will drive a return to operating profit growth “over the next few years”. These investments will ramp in Q3, just as DLTR begins to lap its investments from a year ago and begin realizing the benefits of lower trans-pacific freight rates. Net: while shrink and mix headwinds are shared, DLTR’s sales are inflecting as it begins to lap investments while DG’s sales are declining and investments are ramping; the erroneous conflation of their prospects has created an opportunity.
The dollar store thesis is “broken”
Inflation, rate hikes and fears of a recession led to defensive positioning. Investors moved into dollar stores due to their track record of providing durable growth and profitability in challenging environments. While SSSG has held up, profitability has not. Seeing a “broken” thesis, investors rushed for the exits all at once sending the shares of DG and DLTR down ~55% and ~35%, respectively.
While the shares had to come down in response to disappointing profitability, the magnitude of the selloff presents an opportunity for investors with a 3+ year horizon. In a rush for the exits, investors have overlooked (1) how durable dollar store growth has been for the past decade+, including the unprecedented circumstances provided by COVID (even FD comps help up despite poor execution and under-investment) and (2) the runway for idiosyncratic sales productivity and profitability gains that will be driven by this investment cycle at DLTR.
See Appendix E for a summary of dollar stores’ performance from FY18.
Gross margin declines
In my experience, retail investors flee when gross margins decline y/y as they have for DG (Q2 – (120)bps), DT (Q1/Q2 – (520)bps/(400)bps) and FD (Q1/Q2 – (100)bps/(30)bps). DG’s decline was driven by a mix shift towards consumables (160bps), whereas DT and FDO were driven by a combination of mix shift (220bps and 240bps in Q2, respectively), price cuts (FD 4-5% price cut in late Q2/22, DT rollback of some items to $1) and investments in the quality of the assortment (higher COGS/unit for the same price).
While these developments are clearly negative headlines, they are one-time and, in the case of DT and FD, accompanied by strong upticks in traffic and SSSG. This is reminiscent of the post-earnings selloffs in AutoZone from late 2020 through early 2021 as the company’s commercial mix increased (where customers are more price-sensitive and gross margins are lower) and they cut price on traffic-driving SKUs in which they had become uncompetitive against Walmart. This culminated in a ~7% selloff following Q3/21 earnings reported May 25th, despite traction with the repair shop customer that had alluded the company for years, after which the shares bottomed out at $1,375. In the ~2.5 years since AZO has nearly doubled, compounding at 29%pa.
Rick Dreiling has lost the magic touch
A growing DLTR bear argument is that Dreiling has bit off more than he can chew. At Dollar General, Dreiling was known for under-promising and over-delivering. Bears point to 2 ~10% negative EPS revisions (to FY22 and FY23 guidance) since he joined 6 quarters ago as evidence that he doesn’t have his arms around the issues at Dollar Tree, suggesting that the FY26 targets lack credibility.
In fact, the negative revision in FY22 was to a guide that was set before he joined and did not reflect the investments in price and store operations he deemed necessary (which have already begun to pay off). The cut to FY23 guidance has been driven by (1) the 12c (2%) impact of a one-time legal accrual related to events that transpired under former management and (2) headwinds from mix and shrink, which are largely out of his control. However, despite shrink headwinds intensifying from Q4/22 to Q2/23 as more stores took inventory (75% from 10%), EPS guidance was maintained thanks to an upgraded sales outlook.
In addition, every quarterly guide since Dreiling joined has either been within or above the guided range. Doubts over Dreiling’s ability to turn DLTR around have created an opportunity, and evidence suggests that he will regain his reputation for under-promising and over-delivering (SSSG upgrade).
See Appendix F for a summary of performance versus guidance since Dreiling joined.
Scar tissue
many investors have bet on a DLTR turnaround at various points since 2015 only to be disappointed by countless excuses, poor execution, and mediocre returns. Rightly so, DLTR is a show-me story. Despite the notable inflection over the last 4 quarters, investors are weary of repeating past mistakes. This reticence has created an opportunity.
Sell-side not modeling buybacks
While consensus EPS for FY26 is just over $10 (v $10.77 forecast), the street is not modeling buybacks and instead assumes the cash sits on the balance sheet. Incorporating buybacks takes EPS to $12-$13/share (~$12.75 forecast, or ~$12.30 using average shares outstanding which is 23% above consensus), which is notable given the brokers largely value DLTR on P/E.
Why is now the time to invest in Dollar Tree?
Easier comps ahead: FD will begin lapping price decreases and investments in labor and store operations beginning next quarter and the rollout of improved/expanded assortment (including new private label SKUs) will hit shelves in Q4. Dollar Tree will do the same beginning in Q1/23 and will benefit from ongoing increases in penetration of multi-price offerings across the store base over the rest of FY23. And beyond Both banners will benefit from 7 extra selling days in Q4, which is the most profitable of the year (especially for Dollar Tree due to Halloween, Thanksgiving and Christmas, which drive disproportionate sales of higher-margin discretionary items, all falling in Q4), setting the stage for a positive surprise.
Freight is becoming a tailwind: In response to tightening supply of trans-pacific freight capacity in 2021, Dollar Tree struck multi-year deals at exorbitant rates to secure supply. Those contracts are beginning to roll off, driving significantly lower landing costs (included in inventory) which will begin to flow through the financials in H2. Management have estimated $1/share of EPS benefit in H2/23 and at least another $1/share in 2024+. This works out to at least $580mm of gross profit tailwind over the next 6 quarters. There is scope for further gains over time as current rates from Shanghai to Los Angeles (proxy) are still ~1.5-2.0x pre-COVID rates.
KPIs are turning: As explored above, traffic and SSSG have both responded (seemingly instantly despite no marketing/promotion) to investments in price/value, improved store conditions, and improved/expanded assortment across both banners. In Q1, management reported over 5 million net new customers over the LTM, ranking in the top 10 of all US retailers. The underlying initiatives have multiple years of runway to attract new customers and drive sales productivity (DT multi-price store penetration and expansion of multi-price assortment within penetrated stores, FD store renovations and private label expansion).
Rick Dreiling (Q2/23):
“You heard me say many times that retail is all about growing units, growing transactions, and growing sales per square foot. When these retail fundamentals move in the right direction, everything else follows. I am pleased to report that all 3 are heading in the right direction for us. For the past 2 quarters, both segments posted positive unit growth in consumables, while the market has been negative”.
RISKS & MITIGANTS
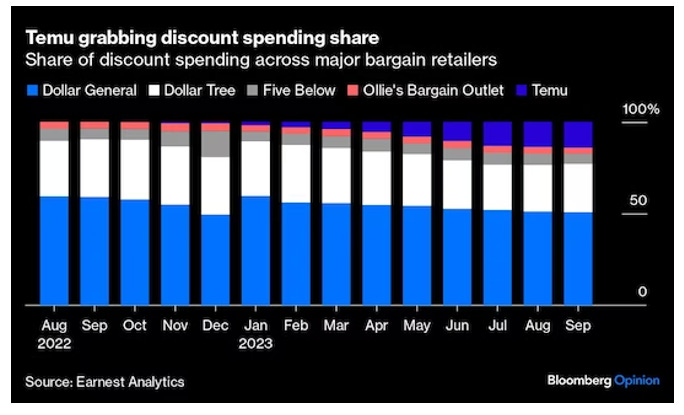
Temu: Temu is an online marketplace operated by Pinduoduo that launched its app in the US in September 2022. The marketplace offers heavily discounted (as little as 14c) goods (primarily discretionary) shipped to consumers directly from China. Recently, outlets like the Washington Post (link) have picked up on credit card data suggesting that Temu is taking share from dollar stores (below) and raised concerns that they will successfully compete for low-income consumers in a way that Amazon never has. This coincides with mix issues across all 3 major banners and is a clear risk to the industry-level thesis that dollar stores are insulated from e-commerce competition. Dollar Tree is most exposed given its discretionary mix.
Mitigant: app reviews suggest a high incidence of “scammy” listings, damaged/delayed deliveries, undelivered orders, incorrect orders, poor customer service and a tight return policy – lower-income customers can’t afford duds and value-oriented middle-income customers are unlikely to return after being fleeced. Dollar stores allow for physical inspection to ensure goods meet size/function/quality requirements.
Mitigant: Temu’s free shipping ranges from 9-20 days (if it is delivered at all); much of what customers buy at dollar stores is for immediate use/consumption (buying decorations at most a few days ahead of intended use). Even if consumers were conscientious enough to order party supplies 20 days in advance (requires a change in behavior/unlikely), the high incidence of late/non-delivered products suggests they cannot depend on their arrival. This is not convenient and constitutes a different use case.
The immediate consumption of goods purchased at Dollar Tree in particular was echoed by a former Director at Family Dollar:
“(DT is) for people who are looking for something quick, doing stuff like parties, doing things like just something I need to pick up for the day, so maybe I can pick up some washing powder for just today, or maybe I can drop in and get this last minute.”
- August 2023, Stream Transcript
Mitigant: many dollar store consumers either don’t have credit cards or live in neighborhoods where packages left at the door by the courier are unlikely to be there when the resident returns home.
Mitigant: Temu is attracting growing scrutiny from the US government due to malware discovered in the app and lack of compliance with regulations to keep goods made by forced labor off its platform.
Disconfirming evidence: Dollar Tree comps have averaged 7% since Temu was launched and accelerated in Q2 driven by a ~10% increase in transactions y/y. Discretionary comps averaged 5.4% over the same period and accelerated in Q2.
Note: the credibility of the Temu threat is supported by coinciding mix issues reported across all 3 major dollar store banners. However, the more likely cause is exhaustion of COVID/stimulus savings, reduced benefits (SNAP, tax credits/refunds), and inflation squeezing discretionary income.
Increasing competitive intensity: in response to recent performance issues, Dollar General has cut prices on merchandise and (<1% of) traffic-driving SKUs and stepped-up investment in wages and store operations. With FD a legitimate competitor for the first time in over a decade, there is a risk that the two chains begin competing on price, creating a risk to gross margins.
Mitigant: following years of poor management and underinvestment, FD has multiple levers to pull to increase store productivity, whereas DG does not. FD also benefits from its skew towards urban markets, where competitive intensity is declining and there are more opportunities to attract new customers.
Wage inflation: Labor accounts for the significant majority of SG&A excluding rent and D&A for dollar stores. Inflation and a tight labor market have driven up wages for store and DC labor across the country and are a key risk to margins.
Mitigant: beginning in Q2/22 Dollar Tree have invested in wages, training, processes, and operating conditions to improve its ability to attract/retain employees. In the previous 2 years, average hourly wages have increased by $2/hr across the employee base with increases assessed on a market-by-market basis. Since then, management has reported steadily declining turnover and increasing weekly applications.
Mitigant: the forecast includes SG&A/sqft growth above that implied by management’s targets to build in a buffer for labor inflation above expectations.
Mitigant: per the most recent Bureau of Labor Statistics report (below), wage pressure is reverting to historical averages which management have corroborated.

ESG (industry wages & working conditions): Bloomberg recently published a hit piece (link) on Dollar General titled “Why Dollar General Might Just Be the Worst Retail Job in America”. Issues include safety (blocking fire escapes to mitigate shrink, asbestos, poor pest control), working conditions (broken/unrepaired HVAC), and compensation (most DG employees earn <$12/hr and 25% earn <$10/hr). Dollar General recently became the first major retailer OSHA categorized as a “severe violator” of workplace safety law. ~50 tons have recently passed policies restricting dollar store expansion.
An excerpt from the Bloomberg article noted above: “I used to be the biggest cheerleader for Dollar General,” says Tammy Stanley, who spent eight years managing locations in Mississippi. “They cared back then” … “Round here, you’re either going to work for a chicken plant or you’re going to work for Dollar General,” she says, and without that store, there’d be nowhere to buy toilet paper.” (Note: could “back then” refer to when Rick Dreiling was running Dollar General?)
Mitigant: DLTR have been investing in wages and working conditions for >1 year and observed a material decline in voluntary turnover over that period. Per the below, they also have fewer documented fines/transgressions.

ESG (food deserts): dollar stores are often blamed for problems such as food deserts/poor diets in low-income communities (diabetes prevalence in food deserts is 2x the national average) and lower employment (6-8 employees versus 15+ for local grocer)
Reality: dollar stores are a response to those problems, not the root cause, and processed food is considerably cheaper per calorie (this is the dark side of capitalism – it’s not ideal, but it’s better than no dollar stores)
Study: a 2016 USDA study found that residents of food deserts choose to eat unhealthy foods even when they have access to full-service grocery stores; 90% of the nutrition gap between have/have-not consumers is estimated to be driven by demand/preferences with the remaining 10% due to inferior access/supply (link)
Mitigant: dollar stores provide essential goods to communities that no one else will; when a DT store burned down in Dayton, Ohio in 2017 the community pleaded for it to be re-opened (link). Per the Dayton Daily News “the store’s closure led to an outpouring of support from local residents who urged its ownership to rebuild because they say the community relies on its low-cost merchandise and food items”.
Tariffs: With 40-42% and 15-17% of DT and FD merchandise being imported predominantly from China, new/increased tariffs present gross margin risk for Dollar Tree.
Mitigant: in recent years Dollar Tree has begun shifting sourcing outside of China to markets like Vietnam and Mexico.
Mitigant: the multi-price model provides DT with flexibility to modify its merchandise and provide compelling value at multiple price points (as opposed to being forced to make a specific item work at $1).
Shrink: Shrink has been reported as a headwind to gross margins across retail (Target, Dollar Tree, Home Depot, TJ Maxx, Kohl’s and Foot Locker, among others) in FY23 (~65bps at DT, ~50bps at FD). Law enforcement does not respond to calls for theft <$1k and many retailers are citing an increase in organized crime (link). Continued growth in theft would create a further headwind to gross margins.
Mitigant: Shrink is positively correlated with employee turnover, which has been steadily declining at DLTR since wages were increased in 2022.
Mitigant: Rick Dreiling has successfully turned shrink from a headwind to a tailwind at Duane Reade and Dollar General and is instituting the shrink reduction playbook at DLTR.
Interdependencies: the number and scope of initiatives underway at DLTR results in several interdependencies. Delays in any projects could catalyze delays in others and defer the realization of benefits/efficiencies leading to disappointment against forecast/guided earnings.
Mitigant: The risk of interdependencies is concentrated in company-wide projects, primarily IT and supply chain. While execution of these initiatives is critical to long-term efficiencies and operating leverage, they are not expected to be material contributors to savings until FY27, limiting the impact on the forecast period.
WHY NOT INVEST IN DOLLAR GENERAL?
With sales per square foot of $272, DG earns 25% more per square foot than Family Dollar and has limited options to drive incremental improvement as reflected by current growth initiatives. Fresh produce, for example, sells at low gross margins and adds considerable cost/complexity to the supply chain while increasing in-store labor demands (storage, stocking, checkout). Given 80% of DG locations are rural, most customers have few alternatives and produce is unlikely to attract meaningful net new customers to offset incremental costs.
In addition, recent commentary suggests that DG has underinvested in stores which will take time to address; management have spoken about returning to operating profit growth “over the next few years”, raising questions over the appropriate terminal operating margin and when it will be realized.
In contrast, Dollar Tree began its investment cycle over a year ago and will begin to lap those investments and deliver operating leverage in the coming quarters. Both banners have clear avenues to improve sales productivity and margins by executing on playbooks that have been proven out by peers (DG and Dollarama), providing greater visibility and odds of success with less downside.
DOWNLOADABLE APPENDICES C ~F:

Stream by AlphaSense is an expert transcript library that helps investment analysts maximize returns with access to tens of thousands of high-quality, searchable, proprietary expert transcripts covering multiple perspectives, industries, and markets. Unlike costly and time-consuming traditional expert network calls, Stream drives faster time to insight, improves ROI, and ensures critical information isn’t missed in the research process. You can sign up for a free trial by clicking here.