


Ryanair Holdings PLC (RYAAY)
The Costco of airlines

In 2007, Warren Buffett wrote in a letter to Berkshire Hathaway investors that “if a far-sighted capitalist had been present at Kitty Hawk, he would have done his successors a huge favor by shooting Orville down.” Buffett has famously been skeptical about investing in airlines for much of his career. In fact, he once quipped that "the worst sort of business is one that grows rapidly, requires significant capital to engender the growth, and then earns little or no money." Historically, airlines fit this description due to their high capital requirements, low-profit margins, and susceptibility to external factors like fuel prices and competition.
Despite his longstanding skepticism, Buffett surprised many in the investing world when Berkshire Hathaway started investing in major U.S. airlines in 2016. Berkshire purchased significant stakes in American Airlines, Delta Air Lines, United Airlines, and Southwest Airlines. This move marked a significant departure from Buffett's previous stance on the industry.
In 2020, amid the COVID-19 pandemic, Berkshire Hathaway sold off large portions of its holdings in the airline industry. The pandemic severely impacted air travel demand, leading to massive losses for airlines and a steep decline in their stock prices. Buffett cited the uncertainty surrounding the future of air travel and the industry's long-term prospects as reasons for divesting Berkshire's airline holdings.
Soon after, as vaccination rates increased and travel restrictions eased in many regions, travel demand recovered. However, the initial rise in stock prices was tempered by the fact that the re-opening was a a complex and gradual process, influenced by various factors including vaccination rates, government policies, and travel restrictions.
Was Buffett right in his initial thesis? We don’t know but we do admire his willingness to change according to the facts. Despite being skeptical of airlines, he followed them and bought positions in them when he saw that together – Delta Air Lines, American Airlines, United Airlines, and Southwest Airlines – controlled 90% of all U.S. domestic air traffic. This typically means pricing power and it was the same setup that lead to the increase in profitability of the North American rail sector.
In our analysis of EPAM, we talked about Buffett's comments regarding the enduring nature of consulting businesses, noting that Berkshire companies seldom change their IT consultants. However, we contend that he could have made a more advantageous choice by investing in Accenture instead of IBM. Similarly, we suggest that Buffett might have found greater success by considering Ryanair, rather than venturing into the turbulent waters of the US airline industry.
Ryanair (RYA) is one of the largest airlines in the world. It has successfully replicated the ultra-low-cost carrier model initially created by Herb Kelleher in the US. The Company is based in Ireland and has a NASDAQ-listed ADR, RYAAY (5 shares of ADR = 1 ordinary share). In fact, we will argue that RYA has taken the Herb Kelleher model as seen by the average fair below:

The Ryanair business is simple to understand, but how it operates and executes this strategy in every part of its business model is incredibly rare.
“The airline industry is full of bullshitters, liars and drunks. We excel at all three in Ireland.”
-Michael O'Leary
Ryanair operates a low-cost carrier model. Each quarter, they re-emphasize their focus on having the lowest fares/costs relative to EU peers. The best analogy for the business model isn’t another transportation or airline business; instead, it is other scaled-shared economy business models, such as Costco and Amazon, which have effectively applied this strategy to retailing. Jeff Bezos’ 2005 Annual Letter to Shareholders explains Michael O’Leary’s basic approach to growing the business.
“As our shareholders know, we have made a decision to continuously and significantly lower prices for customers year after year as our efficiency and scale make it possible. This is an example of a very important decision that cannot be made in a math-based way. In fact, when we lower prices, we go against the math that we can do, which always says that the smart move is to raise prices. We have significant data related to price elasticity. With fair accuracy, we can predict that a price reduction of a certain percentage will result in an increase in units sold of a certain percentage. With rare exceptions, the volume increase in the short-term is never enough to pay for the price decease. However, our quantitative understanding of elasticity is short-term. We can estimate what a price reduction will do this week and this quarter. But we cannot numerically estimate the effect that consistently lowering prices will have on our business over five years or ten years. Our judgment is that relentlessly returning efficiency improvements and scale economies to customers in the form of lower prices creates a virtuous cycle that leads over the long-term to a much larger dollar amount of free cash flow, and thereby to a much more valuable Amazon.com.”
-Jeff Bezos (2005 Shareholder Letter)
This simple approach, which has effectively always stayed the same, has led to tremendous growth at the corporate level. Passengers carried have grown at an 18% CAGR since 1995. Ryan initially mimicked its business model after Southwest (LUV), which performed very well after deregulation in the US. Still, LUV’s strategy drifted over time to focus on higher revenue routes and yields as shown below in Exhibit W, Ryanair did not invent the low-cost airline carrier model, but they have implemented it perfectly in Europe.

Ryanair is a successful business by many measures and has a long track record of growth, high returns on invested capital, and growing market share. The ability to do this in a commodity-like industry is scarce. Most people inevitably look at companies with these financial characteristics and think they have missed the opportunity. We don’t think that’s the case – so while the future drivers might be different from the past, we think there is still a strong possibility for them to generate attractive returns for shareholders today.
RYA is headquartered in Ireland, but most of its routes are centered around the UK, Spain and Italy. The route exposure is skewed mainly to Western European countries but RYA is increasingly expanding in Eastern & Central Europe.
The company’s relentless application of the scale-economies-shared model has created tremendous value for all customers and shareholders. In our opinion, the only major stakeholder their expansion has hurt has been incumbent competitors, who have operated inefficient, higher-cost, and higher-priced routes for far too long.
We see a substantially improved competitive environment going forward as a result of the pandemic. Further, since 2019, over 35 airlines with operations throughout Europe entered into bankruptcy, and Ryanair went from the third-largest airline to the biggest in 2023. One of its key LCC competitors, Wizz Air, is facing challenges tied to its engine exposure (Pratt & Whitney GTF); this might create an environment of better-than-expected yields over the next three years (as we observed in the North American rail sector).
Importantly, the company’s capital allocation activities are expected to shift. In the past, most cash flow has been recycled into additional fleet growth and the rare M&A deal. We would not be surprised to see substantial cash returns to shareholders from now on while still driving positive growth in passengers carried (and capacity additions).
Over the past 12 months, RYA shares have rallied on the strength of consumer spending, employment levels, and a bias on spending on services instead of goods. Despite the move in the stock, we still think the stock can provide attractive returns in the future. A widely underappreciated dynamic will be how much fare pricing could increase as the industry structure matures into a more consolidated state like US markets.
RYA trades at a forward P/E of 9.3x and an EV/FCF Yield of ~11.6% on FY25 estimates - both below historical averages. The company’s healthy balance sheet and FCF generation of >2.5b should allow it to continue executing its growth strategy and increasingly return capital to shareholders as reinvestment needs moderate. Unlike many airlines that eventually drift away from a focus on the LCC model, RYA has been remarkably consistent in its approach. Michael O’Leary has successfully led the company for over 15 years and positioned it well for an attractive “end state” where pricing power might be higher than market participants believe.
In this report, we will review the significant pillars of the business model, review the profit pools of the aviation industry, and talk about risks and valuation. Importantly, we will expand on why airlines are such a horrible business and why Ryan Air is an exception.
Business Overview

Ryanair Holdings is a low-cost airline focused on point-to-point routes, mainly in Europe. The company operates five wholly-owned brands, including Buzz, Lauda, Malta Air, Ryanair DAC and Ryanair UK. Each brand has an Airline Operator Certificate (AOC), which allows them to operate commercial aircraft in the respective country. Ryanair’s business operations are focused only on short-haul travel and related products (i.e. baggage, travel insurance, accommodations bookings, etc). This contrasts with legacy carriers operating various activities, including long-haul travel, cargo shipments, and bundled holiday offerings. Below in Exhibit A, we provide an overview of the estimated fleet size of each brand as of early 2024 and fleet ages.

To execute on this strategy, RYA does a few things:
They operate a primarily Boeing 737 Fleet. As of June 2023, they had 530 Boeing 737 aircraft and 28 Airbus A320 aircraft. RYA’s strategy is to own all its aircraft and have >95% of the asset base unencumbered. Further, RYA has a counter-cyclical reinvestment approach which allows RYA to buy these aircraft at significant discounts to listed prices.
The company operates primarily out of secondary and tertiary airports, meaning it usually has minimal flights out of Europe's most prominent and highest-throughput airports. Dziedic and Warnock-Smith estimate that RYA has the highest share of flights relative to any of its low-cost carrier competitors who go through non-primary airports.
RYA’s asset turnover is high. It focuses on gaining efficiencies in each step of the airplane’s journey such that it can turn around the airplane quickly and utilize that asset to the maximum extent.
Ryan Air’s pricing strategy is focused on driving high utilization of the planes to cover primary costs. Then, ancillary sales, which cover baggage fees, food, drink, retail and other product sales, can drive most of the company's profits. Unlike many other airlines where flight pricing is occasionally cheaper as it approaches the flight date, RYA sometimes does the opposite, keeping very low listed prices at the time of scheduling. Then, adjust the remaining seat prices to be higher or lower depending on the sales pace.
Aviation Industry Overview
The aviation industry consists of many players who operate with various strategies, scales, and adjacent activities. The global group of airlines collectively allow >4.5 billion passengers to be carried worldwide for business purposes or to visit family, friends, and relatives. In aggregate, the airlines generate the largest revenue relative to other parts of the value chain, such as fuel producers, freight forwarders, and airports. Exhibit F, from IATA shows total 2022 revenues generated by different parts of the value chain.

Airlines, however, don’t have as great of a track record of creating value regardless of the specific value creation measurement, as most of the value is passed onto consumers or captured by other parts of the value chain. As Exhibit G below shows, this was true again in 2022. The only exceptions in 2022 were the fuel producers and freight forwarders who could generate an ROIC > WACC.

Airlines as a group are difficult to manage due to challenging competitive factors and the significant impact external shocks can have on the supply and demand sides of the business. With only two major producers of major planes and a consolidated OTA landscape, it’s hard to see how airlines are advantaged when you complete a Porter's Five Forces analysis.
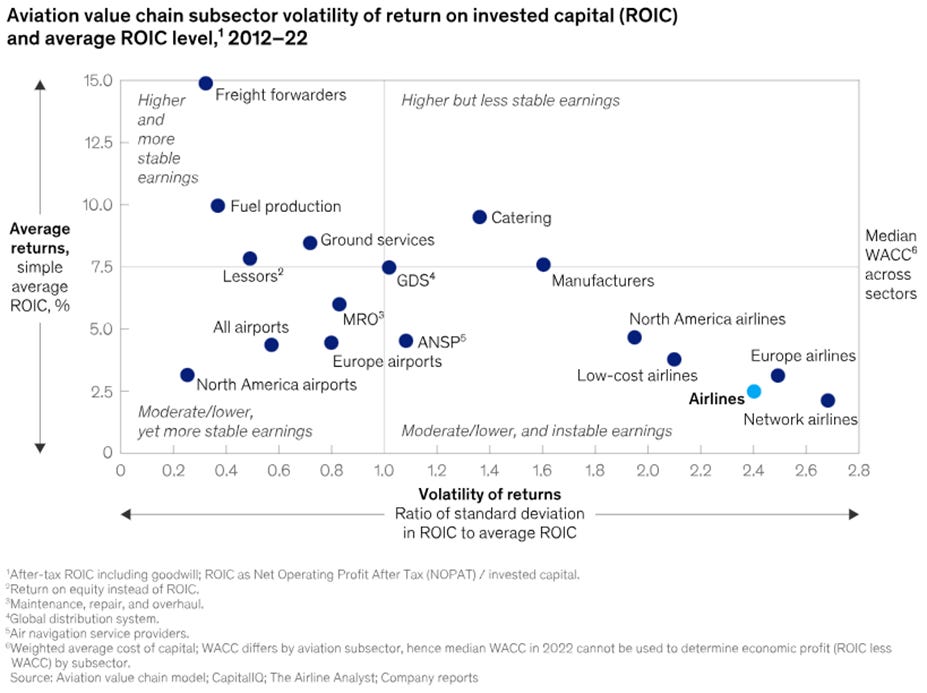
Exhibit H, above from IATA, shows the variability in returns for all the different parts of the value chains. This demonstrates that airlines see the most considerable variability and relatively low returns during 2012-2022. On the opposite end of the spectrum were freight forwarders, which could generate ROICs in the mid-teens with little variability. I’d guess manufacturers fare roughly in the middle due to the concentrated nature of that industry and the multi-year nature of their backlog, which partly insulates to immediate demand or supply shocks. The simplest way to put the state of the industry is that airlines generate the majority of revenues but pass on effectively all the value to their supply chain partners.
Longer-term airlines have had a poor record of creating value as a group ROICs (including goodwill) only in the 6-7% in the better years or ~8% in the best years historically, as shown below in Exhibit.

Why? The structure of airlines is just challenging!
Airlines need to make large fixed investments in aircraft from two major suppliers: Boeing and Airbus.
Engines are a similarly oligopolistic market dominated by Safran, GE Aerospace, Pratt & Whitney, and Rolls-Royce.
Travel throughout the year is seasonal, so equipment doesn’t have the potential to reach very high levels of utilization that other industrial assets can achieve.
Fuel cost are out of their control in the medium or long term, and surprise increases take time to be passed on.
Pilots are often part of unions and a scarce resource in general.
Geopolitical events could impair routes indefinitely or adverse weather that could lead to planes remaining grounded, again totally out of airlines' control.
Demand could rapidly change in deteriorating economic environments, making it hard to quickly adapt the cost base to the new environment.
Customer switching costs are relatively low. They can easily book with a competitor, and many will utilize online travel advisors (OTAs), which are effectively a duopoly market split between Expedia and Booking.
Despite that challenging setup, returns across different regions have begun to diverge, with North American airlines beginning to report double-digit ROICs in 2015-2016, as shown below in Exhibit J. But, the impacts of COVID-19 appear to have delayed the return of this for some time. McKinsey published data showing that 78% of the airlines were generating economic losses, and only a tiny sample of the airlines created value. Later, we’ll explain how Ryan Air is one of those exceptions.

Airlines Strategies and Peer Analysis
Airlines take two approaches at the extreme ends. The first, the most widely known and recognized, is the “network/legacy” carriers who combine short-haul, long-haul, cargo and other related activities. They meet many customers’ needs but focus less on specializing in individual categories. They tend to operate from the most prominent airports worldwide, using these as hubs to drive traffic to other parts of their network. Pricing for these fares is usually much higher and may include some checked baggage, assigned seating, food and beverage services and bundled vacation options. The second strategy, utilized by most low-cost carriers (LCCs), operates effectively only short-haul flights. They skew towards secondary or tertiary airports where impacts from congestion or delays are much less on average. Prices for these services tend to be low on a relative basis but leave customers the option to pay up for a select number of incremental services. For example, food & beverage services are scarce, and secondary activities like cargo shipments are not much of a focus. Lastly, business and luxury travel occurs most frequently with the network carriers, while the LCCs skew toward leisure travel visiting family, friends and relatives (VFR). Exhibit K below highlights how Lufthansa, a sample of a network carrier and Ryanair, a sample of an LCC, operate in the EU Region.

History
The origins of the most successful European airlines are rooted in Ireland. The business was founded by long-time airline executive Tony Ryan, who progressed into managerial roles with Aer Lingus, the national Irish airline. Later, he ended up in a leasing manager role, responsible for finding profitable uses for the company’s excess capacity amidst a broad cyclical downturn driven by a significant oil price shock. Tony Ryan saw ample opportunity in the market, which led him to set up Guinness Peat Aviation (GPA) with 5,000 GBP of his capital combined with support from Aer Lingus and Guinness Peat. Starting with just one second-hand Boeing-737, the air leasing operation reached>$2b in sales by 1991. EBIT margins of >14% were attractive but weren’t sustained due to the 1991 Gulf War, which effectively doubled the oil price. Poor timing for the orders of 700 aircraft and a rapid investor sentiment change led to a failed IPO in 1992. Poor balance sheet management, elevated debt, and a recession led to restructurings and a majority stake sold to General Electric. Tony Ryan stepped down but still netted €55m in proceeds from the sale. While this episode ended in a rather tumultuous fashion, I get the sense he learned some clear lessons about operating in this industry. Going near bankruptcy likely burned in some painful memories about the cyclicality in the airline industry and how harmful it can be for related businesses to rely on capital markets on an ongoing basis.
In 1984, the business now known as Ryanair began operations as “Danren Enterprises,” which was co-founded by Christopher Ryan, Tony Ryan and Liam Lonergan. These individuals brought experience from different parts of the airline industry – Liam brought travel agency expertise, and Tony brought financing and operational expertise. Operations consisted of a single flight of 15 individuals from Waterford to Gatwick, but lack of scale led to consistent losses in most of its early years of operations. Eventually, in 1986, they added a second route from Dublin to Luton. However, with just two routes, competition from incumbents with government support led to ongoing challenges in profitability.
With profitability low and the first phase of deregulations agreed upon in late 1987, significant changes were possible. In 1987, Tony Ryan hired Michael O’Leary as his financial and tax advisor. As part of this role, he was forced to look at the Ryanair operations, but his recommendation wasn’t what Tony expected – he asked for it to be immediately shut down.
“In the late ‘80s, Ryanair was a forerunner of trying to be a lower-cost all-service airline in a marketplace where the all-service airlines didn’t make any money. So being a lower priced, all-service was a recipe for disaster…“I strongly encouraged Tony to close the place down. It would never make any money.”
Tony Ryan persisted because he saw deregulation as a significant factor in the flourishing of other airlines—namely Southwest (LUV), which had built a stellar track record following the US airline industry's deregulation in 1978. Convinced he wasn’t wrong; Tony took Michael to the US to see how LUV was executing day-to-day operations.
“All you needed to see was what Southwest was doing at airports at that time: bring it back and replicate it. Go to a single fleet, do 25 minutes turnarounds, use secondary airports if necessary. In Europe which at the time was bound by ridiculously high air fares, and by legacy airlines, which were hopeless, and you almost couldn't lose, as long as you were sensible.”
By 1993, The European Union had effectively deregulated the airline industry, which expanded the addressable market by many multiples. RYA took the lessons from Herb Kelleher and began applying them to its operations. They simplified routes, focusing on the most profitable routes, and worked through cost reductions across each significant line item. By 1997, they had built up a decent base of disciplined, profitable growth and took the opportunity to go public. Employees were among the biggest winners of this successful IPO, as most participated in the share option scheme. Exhibit D, shows the very strong performance relative to key indexes after IPO. Capital from the IPO was used to fund a hefty $2b order for 45 new Boeing 737-800 aircraft.

In 2000, RYA launched its first website for an investment of just IR£20,000, taking execution risk by partnering with a 17-year-old John Kennedy. Management received other bids as high as IR£3.5m for the website, which was viewed as an unacceptably high investment for a channel with uncertain return prospects. The benefits of this launch were realized steadily over the next nine years; they eliminated check-in desks in most places, pushing major service requirements online. This drove improvements in personnel costs relative to the industry, which were passed onto customers.
By 2001, the poor economic environment and after-effects of the September 11th attacks led to an opportunity for RYA to add to its order book. Ryanair ordered 155 new 737-800 aircraft from Boeing at an estimated 53% discount to the list price, on the high end of discounts reported in the industry.
Then, every few years, RYA began attempts to acquire a challenged competitor. In 2003, they acquired Buzz from KLM. And in 2006, RYA launched an unsuccessful bid to acquire AER Lingus – the largest airline in Ireland. In 2008, RYA re-launched a takeover bid for AER Lingus and outlined plans to double the entity's short-haul fleet from 33 to 66. The board at AER Lingus rejected the offer again and advised shareholders to vote against the deal. The government held a grim view of the impacts the deal could have on competition levels in the country. By 2009, RYA walked away from the deal but continued to hold ~30% of the outstanding shares. Michael O’Leary was undeterred after the initial failed attempts, making multiple bids for the business until AER Lingus’s eventual sale to International Airlines Group (IAG) in 2017.
In 2014, after multiple years of considering negative customer feedback, RYA relaxed its more hostile (but efficient) approach to customers. It launched the “Always getting better” program to be more customer-focused, with the idea that the addressable market was a lot bigger and more profitable if it could serve customers with both low prices and a reasonable level of service. Was RYA losing its way or if Michael O’Leary was getting soft in his old age? No, Michael believed it was the right time for the firm to change its approach.
The business continued to scale up, and RYA reached the limits of having a single Airline Operating Certificate (AOC). This progressed into adding AOCs in Poland, Austria, and the UK. This then led to the separation of CEO roles for each entity, but O’Leary remained the group CEO. Malta Air was created in 2019 in cooperation with the government of Malta, with the expectation of having a fleet of 10 aircraft dedicated to this market.
The COVID-19 pandemic unfolded in early 2020, but O’Leary clearly outlined that state aid was not an option for the firm and that it would change its operations to adapt. This led to thousands of job losses and suspension of most of the company's operations until later in 2020. Like prior periods of turmoil in the economic environment, RYA used this time to purchase more aircraft with an increased 75 orders of Boeing 737 Max 8s, which would be delivered over the next three years. In 2023, RYA again boosted its buying plans with Boeing confirming an order of 300 Boeing 737 Max 10s, translating into $40b at list prices. This counter-cyclical reinvestment approach allowed RYA to be set up to double its annual traffic to 300m passengers by 2034.
We’ll go into more details on the central pillars of the business model:
Low-Fares
RYA targets fares well below peers on its served routes. RYA's extreme positioning often leads to its prices being below competitors' costs. This is accomplished through using a single aircraft type, ownership of planes, maximization of productivity, minimization of customer service costs, and utilization of airports in secondary or tertiary markets.
RYA can accomplish relative cost advantages by using a single aircraft type, the Boeing 737s. Running a fleet of just one aircraft type allows them to drive significant efficiencies tied to personnel training, maintenance activities, spare parts storage and buying power. RYA also believes owning its aircraft is better if it can buy aircraft at the right times and internalize any leasing margins that financing providers would capture. Gridpoint consulting had a great piece comparing ownership and maintenance costs across different LCCs in Europe; the key points being that RYA stands out due to the better terms it gets from aircraft and engine suppliers relative to peers. Their buying power funded by FCF generation rather than capital markets also helps keep full cycle ownership costs low with effectively no interest expense paid over the life of the assets. There may be some modest benefits from its domicile in Ireland a well-known lower tax rate region.

Personnel costs are minimized through a high prioritization of productivity. This means quick turnarounds when connected to gates. RYA runs aircraft on an average of 6 flights per day, which is on the higher end of all narrow-body operators in Europe. Correspondingly, it chooses routes at the appropriate length to allow this revenue capture ~6x a day. This can only happen at secondary airports as they are generally more liberal on the curfews for the last flights in or out of the airport. RYA’s ability to operate in this way is also due to its higher exposure to customers who are visiting friends or relatives (VFR), who are generally more flexible on departure or arrival times. The incremental economics of the last flight are especially attractive as RYA can generate additional operating leverage on fixed costs like aircraft ownership and sales & marketing.
RYA uses contractors to handle ticketing, passenger, and aircraft handling to keep customer service costs low. Very early in its history, the use of call centers provided a relative cost advantage compared to the industry. However, in recent years, driving more sales directly through its website and phone applications has provided a relative benefit compared to sourcing customers from GDS platforms and Online Travel Advisors (OTAs).
Lastly, they have widely prioritized flights through airports with more competitive access and handling costs. This means secondary airports are often major travel hubs instead of primary ones. Even at these secondary airports, RYA takes every step to drive down costs – often selecting outdoor seating. Narrowbody operators are also favored by airports to run flights slightly earlier in the day and at night as they are quieter and these incremental flights have a more moderate impact on the environment for locals. I suspect the reduced level of throughput at these secondary airports also leads to lower impacts from congestion or delays and a broadly lower level of restrictions as utilization levels of runways/infrastructure tend to be lower.
Point-to-Point Flights
Point-to-point flights are offered most frequently. In 2023, RYA flew an average route length of 766 miles and an average flight of 2.2 hours. The nature of the shorter flights allows them to avoid serving meals and in-flight entertainment, which customers expect on longer-duration flights. Direct point-to-point flights also remove frictions associated with connecting passengers to other parts of its network or baggage transfers. RYA runs near the most flights per day and can do this because of the short average flight duration.
Digital distribution
RYA sources ~10-20% of its flights from OTAs and travel agents, with the rest achieved through a direct relationship with customers. RYA leverages its partnership with Navitaire to offer internet and mobile booking services. In most cases, even additional common day of charges, such as checked baggage or priority boarding, must be purchased through the application. In recent years, Michael O’Leary has actively called out OTAs for marking up their offerings at excessive levels (Exhibit Z below) and even taking steps to remove their inventory from the websites. Management believed that while there was a short-term headwind from clearing the inventory from this channel, they believed this was the right step to protect consumers from being overcharged and build a longer-term relationship with OTAs they thought were operating more in line with their primary goal of delivering low-cost travel fares.

High Contribution of Revenues from Ancillary Services
RYA sells travel insurance, priority boarding, parking, transfers, and accommodation through its website and mobile phone applications. We’ll touch on this later, but RYA’s pricing model focuses on pricing low enough to get >90% utilization. Then, the majority of profitability is generated by high-margin ancillary sales.
Opportunistic Approach to Market Challenges
RYA’s LCC and ownership models allow it to fare much better during demand or supply shocks. While other airlines are managing liquidity challenges and cutting costs, RYA has typically taken offensive positions. They have opportunistically announced major purchases of additional aircraft during periods of turmoil, such as 9/11 or COVID-19, which has allowed it much better bargaining power than in everyday environments. Market disruptions have also provided slot availability into attractive markets that would have otherwise been difficult to enter.
Unit Economics & Competition
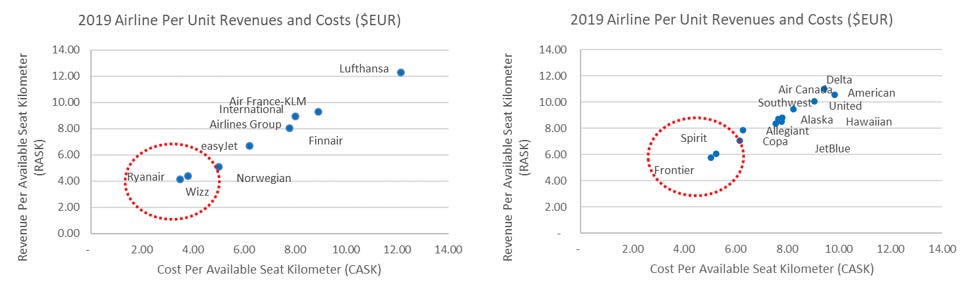
As we examine how the broader group of European and US airlines compare on key metrics. Airlines measure their capacity on an available seat kilometre (ASK) or mile (ASM) basis, a unit measure for the distance one seat flies. If there are 100 seats on a plane which flies a route of 1,000 kilometres and 100 seats on a plane which flies a route of 1,000 kilometres, then the resulting ASK would be (100 x 1,000 ) = 100,000 ASK. This data point can then be utilized to calculate the amount of revenue (RASK) or costs (CASK) an airline is incurring on a unit basis.
In Exhibit M, we look at data from 2019, then separate the two geographic regions to give a more detailed look at the EU landscape for airlines. The two closest business models to RYA are Frontier and Spirit in the US and Wizz and Easyjet in Europe. If we remember that the top ten airlines in NA represent 89% of seats in the EU, they represent just 50% of the market – this appears to translate into higher pricing power, a critical point we’ll get back to later.
The data above looked only at the industry's pre-pandemic position, but the COVID-19 environment impacted the industry materially. Exhibit N, captures the changes in this period, which shows that costs are up relative to 2019 levels, but revenues are generally up much more.

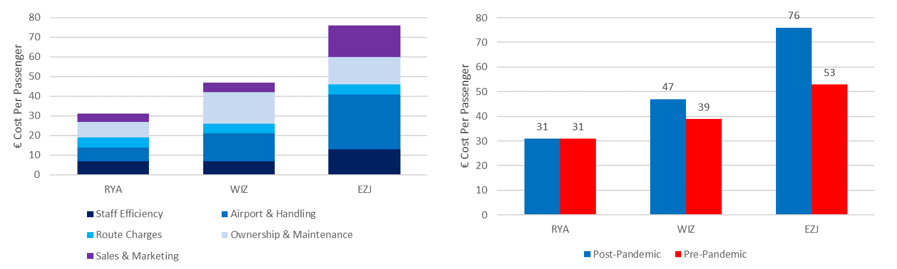
Relative to its peers, Ryanair held at least a 34% cost structure advance on a per-passenger basis, as shown in Exhibit O below. This relative advantage even holds up against Wizz Air, which operates a similar business model but utilizes Airbus narrow-body aircraft and focuses on CEE markets rather than Western European markets. RYA’s cost advantages hold on an aggregate basis despite Wizz having better staff and sales and marketing costs, given its exposure to CEE labour markets. However, given its smaller scale, Wizz had higher Airport & Handling costs, likely due to lower bargaining power, airport selection impacts and relatively high ownership/maintenance costs.

RYA’s scale-economies-shared model means these savings go back to the customer through lower prices, which drives higher load factors across its routes. This is evident from the average fares it charged, just 37 EUR per passenger, versus European peers, which averaged 129 EUR per passenger, as shown below in Exhibit P.
Due to its unique business model, RYA had an enviable cost position pre-pandemic. As shown below in Exhibit R, even after the pandemic, costs have remained similar on a per-passenger basis. Low-cost peers like Wizz and Easyjet have struggled on this basis, seeing 21% and 43% inflation in costs per passenger, respectively. This has been driven by higher costs across all categories except Route Charges, which were flat.
We expect that both RYA and Wizz will continue to grow rationally over time and are unlikely to compete that aggressively against each other. Too much energy in the media is focused on route battles. Instead, we should be looking at the fact that both have been able to grow revenues and profitability in countries – Exhibit S below shows data from Poland as an example of this dynamic. While an “end-state” is hard to predict definitively across many markets, it seems possible that LCC share will be up modestly over the long term.

Some people believe that the past share capture will make it more difficult for the LCCs to capture market share going forward, but these claims have been occurring for a long time. These concerns lingered in 2023, and new academic articles were published highlighting how the future would be a bit more difficult.
“The European market is at a very mature stage with high levels of competition, which in practice means that most profitable routes are already exploited. The diminishing returns from adding capacity within Europe do not permit the expansion's speed to be maintained. In parallel, being close to reaching full geographic potential, there is a need to expand outside the EU + EEA. Still, the lack of international aviation agreements is a hurdle for most potential markets in Eastern Europe, the Middle East and Africa.” - (Efthymiou & Christidis 2023)
The overall points are reasonable, but the authors overlook the US market's end state, which is probably the best analogy to utilize. Exhibit T shows that the top 10 airlines represented captured 89% of the US market. In Europe, the top 10 only reached 50% of the market despite the overall market size being relatively similar. This suggests that the growth opportunity is far from over with further consolidation, either through M&A or organic growth of the LCCs. Large competitors like AFM-KLM and Lufthansa have announced significant capacity reductions, which should also free up slots at more European airports than we have seen historically.

The turmoil seen over the last four years has helped the business, but I don’t think all the benefits of a more consolidated industry are evident in the results yet. As show below in Exhibit V, these exits from the market have not translated into higher fare prices yet – we think it will, but it’s just a matter of when RYA decides to flex this muscle.

In a commodity industry, the most sustainable competitive advantage that a business can have is low costs and, as we have shown above, RYA has the lowest cost in the industry. Many investors have a negative association with airlines, and deservedly so, but RYA is an exception and, we would argue, that this exception will sustain.
Risks
Fuel Prices
Fuel Price shocks rank as one of the biggest concerns when I’ve discussed airlines with other investors. It’s a justifiable concern, given it represents >35% of total operating costs for the business and is out of most airlines' control. Most airlines take some steps to hedge their exposure to mitigate near-term shocks; in the longer term, they don’t have any control over what they are paying. LCCs are more insulated throughout a cycle, given lower fuel costs on a unit basis, as we show in Exhibit AB.

The lower per-unit costs translate into more persistent profits for LCCs. If we look at a sample of LCCs vs FSCs, we see a standard deviation of profits of 1.2 vs 1.7 looking at 1998-2023 data. Exhibit AC below also shows, most importantly, in the worst periods in the past where demand shocks have occurred, LCCs fare better in each scenario.
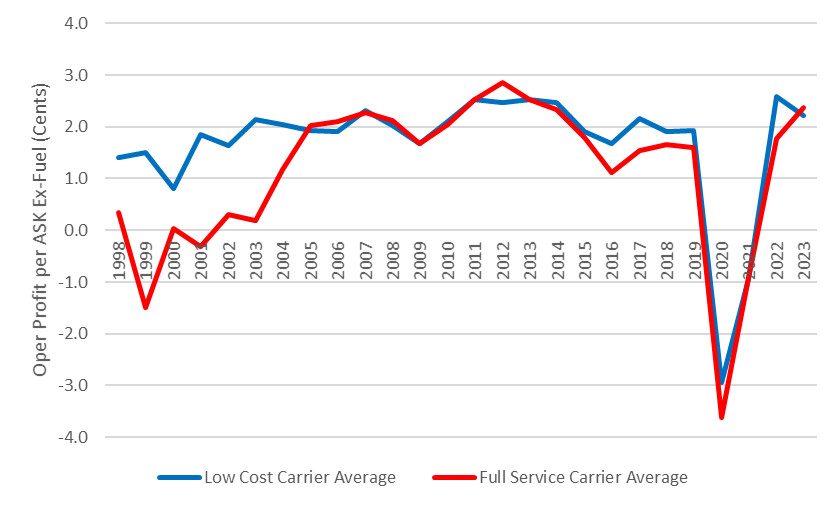
We can slice the data in one more way if we look at Operating profits per ASK relative to the change in fuel costs per ASK. In Exhibit AD Below, On the Y-axis, we can see the majority of LCC (blue) data points above the X-axis, and there is a tight relationship even with variability in fuel. For the FSC, we see much wider variability and a larger proportion of data points below the x-axis showing negative profitably. As outlined before, RYA is amongst the best positioned in the LCC space to maintain and improve its cost structure going forward, and higher oil prices are not our biggest concern for our RYA thesis.

Management
Michael O’leary has been CEO of RYA since 1994. With 30 years in the leadership position and at age 62 he’s likely to step away from the business at some point over the next decade. We are not certain that the Buzz or Lauda deals were home runs, but they both came with some strategic benefits, like adding lots of slots, which helped ramp up growth in specific markets. The added complexity of having some Airbus aircraft is probably a minor annoyance, but we don’t see it as material. Capital allocation under his leadership has rightly focused on organic reinvestment opportunities and generally shied away from M&A. Late last year, they introduced a nominal dividend, which marked a significant turning point in the company’s history. His approach of studying competitors, borrowing what he thought was useful and tweaking it reminds us much more of Sam Walton than any other executive.
One of my favorite examples of O’Leary’s creative negotiation capabilities was at the Prestwick airport in Scotland.
“It agreed to waive all landing, passenger and air-traffic control charges, costing it about £650,000 in its first year and £800,000 the next. The airport’s logic was that it had not enjoyed the benefit of a scheduled service for the previous five years and that it would make money from duty-free sales, catering and car-parking facilities, which had been non-existent up to then. The critics insisted it was too generous a deal to give to Ryanair and would not work for Prestwick, but O’Leary was adamant that it had to work for both. He explained his model to all potential airport partners: he needed them to be profitable to remain open to service his flights. It wasn’t a smash-and-grab; it was a long-term strategy to the benefit of everyone. Yes, there might be an initial outlay or loss, but the point of it was for them to move from being low-volume, high-cost entities to being busy, high volume and low cost.”
The compensation policy at RYA looks relatively standard for the most part. STIP is based on annual traffic targets, customer service scores, and environmental targets. In 2019, O’Leary participated in the LTIP program, giving him a 10m share option grant with a strike price of 11.12. These options would be in the money if RYA delivered profit after tax of >2.2b EUR in any year ahead of March 2028 or if the average stock price exceeded 21EUR for 28 days. The options can only be exercised in 2028-2029, so the long-term nature of it is good, but some shareholders might complain he doesn’t have sufficient exposure to the downside scenarios. It’s not ideal, but he’s been a good steward for shareholders and owns ~900m EUR of stock, which we think should reasonably incentivize him. The rest of the executives also participate in the LTIP, which is paid out based on the discretion of the remuneration committee based on traffic growth, EPS growth, relative TSR vs airlines and the achievement of ESG targets with the majority of metrics measured over 3 or 5-year periods. Overall, some decent ownership at the management level of the firm and a reasonable structure from what we can see.
Valuation
Ryanair has a market cap of €23b and an estimated net cash position of ~1.3b as of YE FY24. The stock trades at 9.0x P/E (NTM), close to a 50% discount to its long-term trading multiple of ~14x going back to 2005.
We believe the discount is driven by concerns about a potential recession, the impacts that carbon taxes could have on demand, and uncertainty surrounding the pace of deliveries from Boeing as it deals with regulatory concerns and manufacturing challenges.
Predicting a recession is difficult, but given the business's balance sheet positioning and lower capital intensity, they appear well-positioned to navigate this challenge. Carbon taxes will narrow the cost advantage relative to network peers at the margin. Still, we don’t see it as anything different from what they have experienced with higher oil prices during certain periods in the past.
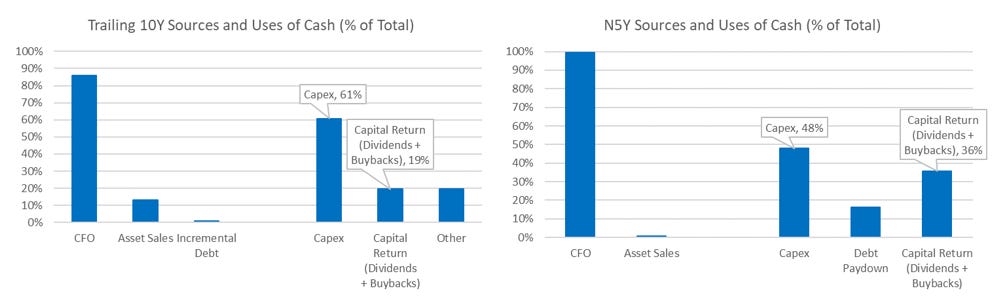
On an FCF to EV on 2025 estimates, the stock offers an 11.5% yield. In Exhibit AF, below, we highlight the sources and uses of cash over the prior decade – showing the majority of cash generated was reinvested in Capex and the remainder utilized for buybacks. Going forward, we see the potential for cash returns to grow meaningfully and capex into planes to fall to ~48% of cash generated over the next five years. This is even after we include impacts from the delivery of ~140 planes from Boeing. We don’t believe investors adequately incorporate the potential magnitude of cash that will be returned to shareholders through buybacks and dividends. There is also the possibility that a growing dividend attracts a wider investor base than what we have historically seen.
At a 14x P/E multiple, we see an 87% upside over the next ~3 years, if we believe management can realize its targets for passengers carried by 2027 and profitability per passenger is €12. We believe this is a fair base case to utilize as management has built a strong track record for delivering on operational growth targets historically.
But, if that wasn’t attractive enough, there is an increasing probability over time that per-passenger profits drift higher than what we’ve seen historically. O’Leary talked about this in 2022, but the first mentions of it might have been earlier – higher prices should be expected across the industry as supply chain inflation, higher interest rates, and incoming carbon levy’s should all push up the cost curve to operate for the industry.
“We think that 40 euros needs to edge up towards maybe 50 euros over the next five years. So the £35 average fare in the U.K. will rise to maybe £42 or £43,” he said.
“There’s no doubt that at the lower end of the marketplace, our really cheap promotional fares, the one euro fares, the 99 cent fares, even the 9.99 fares, I think you will not see those fares for the next number of years.”
Ryanair is not planning on hiking prices across its offerings, however.
“Ryanair will still have millions of seats available at 19.99, 24.99 and 29.99,” O’Leary said. “Now that will still be a fraction of the high fares that BA and our other competitors are charging.”

Balance sheet risks are limited due to the company's current net cash position and the business model's negative net working capital structure, which has customers paying in advance of the service delivery. With the entire asset base effectively unencumbered with leases or debt, the company can seek asset-based financing if it requires it on a short-term basis.
Summary
The above factors sound great in theory, but looking at the cost figures RYA regularly publishes each quarter to investors, it is evident this translates into both superior profits and a strong competitive position. It's really important when you think about the long-term sustainability of its moat—it's not just one thing they do better - it's many little things that add up.
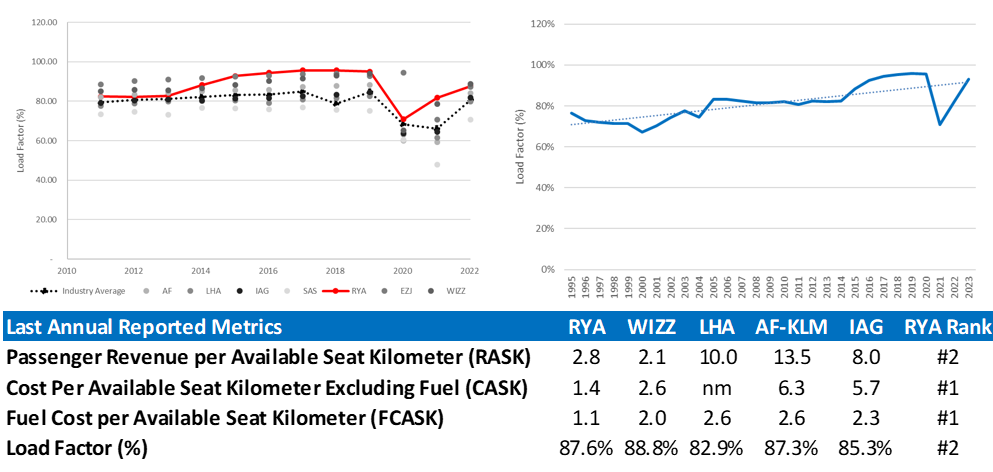
To recap the positioning, RYA charges near the lowest across the industry for travel. They can do this because they have the lowest costs in the industry, including all cost items, but also on just a fuel basis. Their ability to charge very low prices has led to significant demand creation (“The Ryanair Effect) in new markets. Operationally, as the routes have matured and consumers have become more comfortable with the offering this has led to steadily improving load factors (utilization) on a corporate basis – it has improved from 73% in 1995-2004 to 83% from 2005 to 2015 and 91% on average for the last 9 years. As high load factors are sustained and growth investment continues to taper off we’d expect returns on invested capital to drift to the mid/high teens.
We think there are attractive return prospects here and a few life-threatening risk factors that will impair the business.
We’d love to engage with readers by providing feedback on our analysis and any areas where we might be wrong.
Disclosure: The author or the editor have no position in RyanAir at this time. The above is for informational purposes only. We may be wrong in our analysis and we encourage all readers to come to their own conclusions.