This report was written by Gwen Hofmeyr and lightly edited by Value Punks. We believe this report showcases some excellent analytical skills. If you or someone you know is looking for an analyst or otherwise partner with Gwen, please reach out to Gwen at gwenhofmeyr@gmail.com.
Introduction
Since the collapse of Silicon Valley Bank in March 2023, US regional banks have been largely dismissed as un-investable.
Through interviews, common responses for sector avoidance have included:
“There are too many regional banks in the US to analyze. There are a lot fewer in Canada.”
“I do not look at banks because I cannot understand them.”
“I feel the US banking sector is weak following the Silicon Valley Bank Crisis, and therefore, I am not interested.”
The commentary builds on the sentiment since the Great Financial Crisis (GFC) that banks are black boxes riddled with complexity and moral hazard. The work required to discern between financial flowers and weeds is not worthwhile. With over 300 regional banks listed on senior US exchanges, the naysayers are somewhat right: Comparative analysis of the sector is cumbersome. But for what bank critics gain in apathy, they lose in understanding.
Understanding the US banking sector is not only a time-consuming process but also necessary for any investor seeking to make informed decisions. We can identify businesses with unique economic and behavioral characteristics by conducting industry-wide comparative analysis. This knowledge is invaluable, equipping investors with the tools to effectively navigate and capitalize on challenging market conditions when they arise.
To narrow this report’s scope, the comparative dataset comprises 138 banks within the SDPR S&P Regional Banking Index (KRE), the primary index used to measure US regional bank performance. Notably, the dataset was mostly manually derived and calculated for accuracy assurance due to screening issues with S&P CapIQ, such as loan category, balance sheet conflation, and missing and erroneous data. At completion, the dataset included over 3,600 data points.
The motivation behind dataset construction was to highlight the economic significance of a non-KRE bank, Hingham Institution for Savings (NASDAQ:HIFS), and to identify informative industry correlations. Through dataset analysis, Hingham’s economic prowess was confirmed. Results show significant outperformance versus KRE incumbents across operational, managerial, and profitability metrics on a cross-cycle basis. Additionally, Hingham’s structural simplicity, corroborated by several KRE banks, contradicts investor sentiment that denigrates banks as wholly indecipherable. Research further uncovered notable correlations associated with bank management tenure, derivative exposure, and insider ownership, which will be discussed throughout this report.
Although this report provides perfunctory insight into the industry, general investor apathy towards US regional banks, in tandem with analytical complexity, suggests they are ripe for further analysis. After all, opportunity is often found where others are unwilling to look.
Hingham Institution for Savings
Business Overview
Hingham Institution for Savings is a US regional bank located in Hingham, Massachusetts, that is run by CEO Robert H. Gaughen and COO Patrick R. Gaughen. The bank specializes in commercial real estate (CRE) lending, with most of its $3.81 billion loan book allocated to multifamily apartment buildings, 1-4 family residences, and mixed-use properties. Loan book allocations focus on three markets: Massachusetts (67%), Washington D.C. (30%), and San Francisco (3%), with operations conducted online and through six Massachusetts-based branches. The bank was wrested by Robert in 1993 through a proxy contest, where he successfully replaced the board after years of poor business results. You may access his proxy fight letters here and here.
Comparative Loan Book Breakdowns
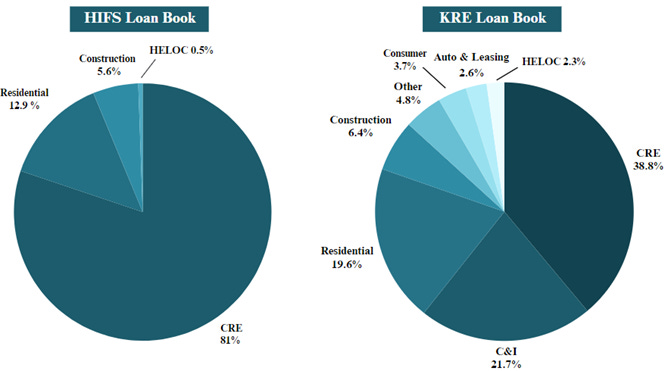
Hingham has the second highest weighting to CRE relative to the KRE, comprising 81% of loans versus 38.8% for the average. Columbia Financial leads the pack for total CRE exposure at 84.5% of loans, with a comparably significant 54% weighting in multifamily and 1-4 family mortgages. Regarding commercial multifamily, 1-4 family, and mixed-use real estate, Hingham has the highest concentration of any KRE bank, at 66% of loans. Hingham also underwrites residential mortgages and construction loans, comprising 12.9% and 5.6% of loans, respectively.
Regarding Hingham’s $508.4MM office exposure, 15% consists of low-leverage loans underwritten for two national labour unions, which management considers to be its lowest-risk loans. An additional 10% relates to existing client office-to-apartment conversions where Hingham has complete balance sheet insight. At the same time, the remaining difference lacks any investor-grade commercial office exposure, with multi-tenant, medical, legal and dental offices favoured.
Hingham’s loan book consists of 99% mortgages, of which 26% are fixed-rate, and 74% are adjustable or variable rate. Adjustable-rate loans are underwritten with an initial fixed period of three-to-ten years, after which they adjust every five years indexed to Prime, FHLB, and treasury rates.
Since Hingham favours residential, 1-4 family, and multifamily properties, its loan book is mainly counter-cyclical. Conversely, the average KRE loan book has higher exposure to more traditionally cyclical loans, like commercial and industrial, auto, and consumer loans, which makes Hingham’s concentrated business model unique in the dataset.
Most banks structure their loan books to moderate both interest rate and economic sensitivity by underwriting a combination of variable, adjustable, and fixed-rate loans with diversified durations. They also typically hold exposure to derivatives intended to account for short-term risks, such as shifts in interest rates and foreign exchange.
However, practices wrought with moral hazard, like secondary lending and participations, permeate the sector. High relative consumer, auto, C&I, investor-grade CRE, and specialty loans exacerbate loan non-performance during recessions, while poor disclosure and derivative holdings obfuscate credit quality assessment and business understanding.
Comparative Economics
Profitability
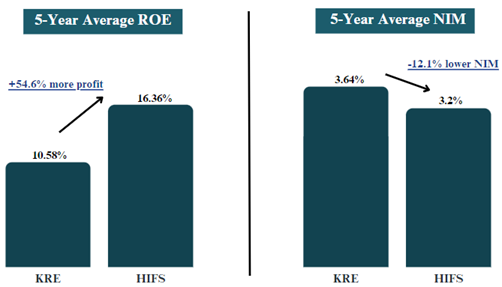
As Hingham’s management prefers conservative, high-quality loans, an investor might expect the bank to report below-average profitability, but that is not the case. A key aspect of dataset construction included measuring average KRE-incumbent net interest margin (NIM) and return on equity (ROE) on a five and ten-year basis. Comparative analysis revealed substantial average ROE outperformance by Hingham, yet curious underperformance re five-year average NIM.
Even more interestingly, Hingham’s ROE has improved over time.
Upon closer inspection, the profit disparity between Hingham’s NIM and ROE is explained by unusual operational efficiency and incremental cost improvements.
For those unfamiliar with bank analysis, the standard way to gauge a bank’s efficiency is to calculate its efficiency ratio. The ratio shows how efficiently a bank manages its assets as a percentage of operating costs. It is accomplished by dividing a bank’s non-interest expenses by provision-adjusted, non-interest, and interest-income sources. The lower the non-interest operating expenses as a percentage of total provision-adjusted income, the more efficient the bank.
To calculate the efficiency ratio, conduct the following equation:
Non-interest expense ÷
Net interest income + Non-interest income - Provision for loan losses
Pre-GFC, Hingham was already the most efficient New England bank, with an average efficiency ratio of 47.7%. This ratio would be impressive by today’s standards, with only eighteen KRE banks having an average efficiency ratio of 50% or less on a five-year basis.
Over the past decade, Hingham’s efficiency has further improved, such that no KRE bank exceeds it. In the last five years, Hingham’s efficiency ratio has averaged 26.7% versus 57.4% for the KRE, a spread of 115%. Hingham’s revenue per employee has also vastly exceeded KRE averages, including the 90th percentile.
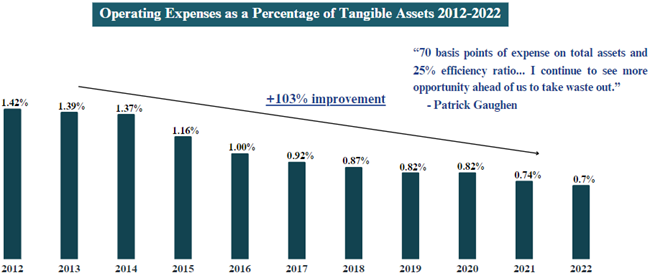
When the yield curve inverts, the efficiency ratio becomes unreliable, as a bank’s NIM may compress. To confirm a bank’s efficiency, divide its non-interest expenses by its tangible assets. Like the efficiency ratio, the lower operating expenses are as a percentage of a bank’s tangible assets, the more efficient it is. For Hingham, a ten-year application of this measurement adds credence to management’s ceaseless focus on removing operational waste.
Efficiency Improvements Coincide with Loan Quality Improvements
A common belief is that when a bank focuses on efficiency, it must sacrifice loan quality in exchange. In the 1980s, this bias permeated the auto industry, and Toyota mistakenly labelled it as a maker of cheap and unsafe cars; Hingham unfairly suffered the same bias.
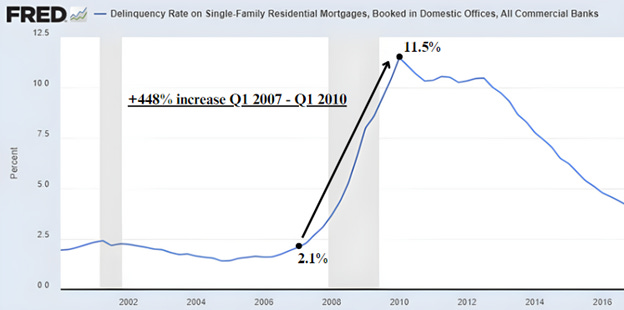
Post-GFC, Hingham’s residential mortgage book has been intentionally reduced by 71.3%. Residential mortgages are cost-intensive and require a large employee base to achieve sufficient growth. They are also sensitive to economic contractions and rising interest rates, increasing the likelihood of cross-cycle loan non-performance.
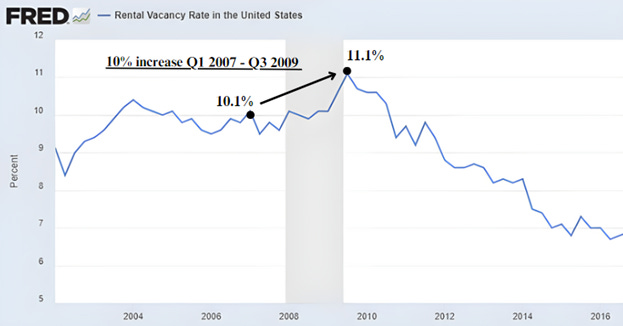
By comparison, multifamily mortgages are considered among the safest loans to underwrite. Apartment rental property values may vary in recessionary periods. Still, rental vacancy rates are far less economically sensitive than single-family foreclosure rates, providing multifamily property owners with increased income stability in challenging economic conditions.
Multifamily mortgages are also larger and less cost-intensive to underwrite, with commercial relationships creating the potential for lucrative repeat business. As a result, Hingham’s loan book has grown by 430% since 2009, while its employee base and branches have shrunk by -23.4% and -50%, respectively. By favouring multifamily, 1-4 family, and mixed-use CRE, management has clarified that increased efficiency does not necessitate sacrificing quality, for Hingham has demonstrated simultaneous improvements in both.
Loan Book Mechanics
Although Hingham’s business model is an example of how a bank manager might improve the quality and efficiency of their bank, it is rarely practiced.
Multifamily mortgages are liability-sensitive, which means they perform poorly in the late stages of an economic cycle when interest rates rise and spirits are high. Conversely, when the economy tumbles, multifamily loans return to performance; i.e., multifamily sulks when the crowd is euphoric and parties when the crowd is depressed.
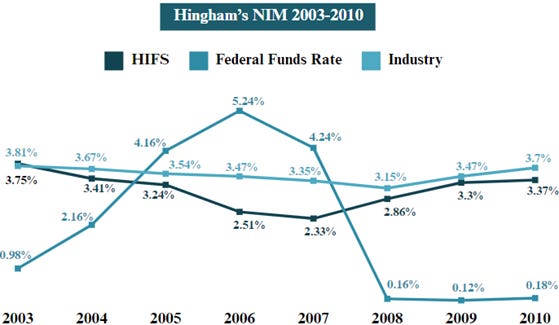
Case and point: Between 2003 and 2006, US rates rose from 1% to 5.25%, while Hingham’s net income fell 25% in response. When rates began to decline in the third quarter of 2007, Hingham’s profits recovered, while industry exposure to subprime mortgages and recession-sensitive loans caused disproportionate industry losses.
Net profit for US banks fell from an average of $124MM in Q4 2006 to -$12.4MM by Q4 2009, while Hingham’s net profit grew from $4.64MM to $8.04MM over the same period. Despite a -145 basis point decline in NIM, Hingham reported no net losses and began recovery a year earlier than the industry. Comparatively, the industry only saw a -60 basis point decline in average NIM yet reported stark losses due to extraordinary loan non-performance. The latter is a warning for investors presently focused on banks with positive NIM without considering the economic sensitivity and credit quality of the loans they buy exposure to.
The yield curve has once more inverted, only this time, the inversion is faster and steeper than any on record. Consequently, the spread between Hingham’s interest-earning assets and its cost of funds has collapsed. In Q1 2022, the net spread between Hingham’s interest-earning assets and interest-bearing liabilities was 3.24%. As of the third quarter, Hingham’s net spread has fallen to 0.39%, well below the 2.56% KRE average.
When interest rates rise, Hingham’s interest-earning assets adjust slower to its cost of funds. Credit quality is a top priority for Hingham’s management, as loan performance must remain high in recessionary periods to ensure adequate liquidity. One way to assess a bank’s credit quality is to measure historical loan performance during recessions and ensure prudent underwriting standards continue.
During the GFC, Hingham had the lowest peak net charge-offs of any bank in the dataset at 0.07% of loans versus 1.81% for the KRE and 3.14% industry-wide. Hingham’s solid loan performance affirms management’s conservatism, with it being one of two banks in the dataset with 0% non-performing loans (NPLs) on a TTM basis. Additionally, loan book LTV is a low 54%, with the office portion sub-50%. To add a cherry, a surprising 69% of Hingham’s mortgages are collateralized by Massachusetts real estate.
Underwriting and Yield Curve Safeguards
Underwriting Standards
Concerning Hingham’s underwriting standards, they are a dataset anomaly. Spare for Robert and Patrick, who may underwrite home equity loans up to $250,000, no lender or officer may underwrite a loan without approval from Hingham’s eight-member executive committee. Every collateral property requires an in-person visit from an executive committee member, and any loan over $2MM requires full fifteen-member board approval. With an average tenure of 20.5 years (double the KRE’s 10.2), the board has met twice monthly to discuss and approve loans for over 20 years.
“If the board isn’t involved in the loan process, then what are they doing?”
— Robert Gaughen, 2023 Annual General Meeting
Balance Sheet Strength
As owners of Hingham, Robert and Patrick are acutely aware of the liability-sensitive nature of their business and have intentionally structured Hingham’s balance sheet and loan book to endure rising rate environments.
First, depositor comfort is vital in the wake of increased rate sensitivity. Hingham’s management has opted to insure deposits 100% through the FDIC and DIF for over twenty years to account for the risk that short-term earnings retractions may have on depositor confidence.
Second, Hingham maintains a strong balance sheet with conservative non-loan asset allocations. Cash balance as a percentage of tangible assets is 8.6% versus 5.3% for the KRE, while Hingham’s tangible equity-to-assets is 9.2% versus 8.2% for the KRE. Furthermore, Hingham’s non-loan asset book is disproportionately weighted in cash, with FHLB stock and a conservative portfolio of equities comprising the difference. In contrast, the average KRE bank maintains a higher-levered mix of non-loan and derivative assets. The average KRE manager endangers economic resilience, simplicity, and higher long-term returns in exchange for short-term investor appeal.
Loan Adjustments
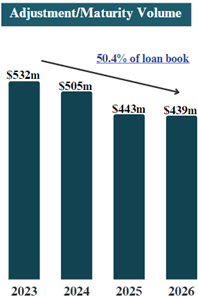
As mentioned, 74% of Hingham’s mortgages are adjustable-rate, but that was not always the case. Pre-GFC, only 48% of Hingham’s loans were adjustable, and management engaged in secondary residential mortgage lending. Following the GFC, management increased adjustable-rate exposure by 54% to reduce interest rate sensitivity and closed their secondary lending business. Each year, more than 10% of Hingham’s loan book adjusts or matures, which helps provide funds relief when rates increase. By 2026, roughly half of Hingham’s loan book will have adjusted or matured following the bulk of Fed rate hikes.
In addition to funds relief, adjustments also improve the present fair value of loans. There is no escaping the reality that higher interest rates negatively impact the face value of loans with a fixed-rate component. Even so, Hingham is not in the business of buying and selling loans: Management underwrites simple loans to hold with a high probability of repayment. Eventually, the overwhelming majority of Hingham’s loans will be repaid at par, with present fair value changes a short-term concern cushioned by ample liquidity.
Loan Originations
New loan originations are also a critical NIM stabilizer, with Hingham’s TTM loan growth at 6.9%. Sequential loan growth over the next few years will also help provide NIM stabilization should interest rates remain higher.
FHLB Advances
The coup de grâce of Hingham’s defence against yield curve inversions lies in the quality of its loan book, for Federal Home Loan Banks prize multifamily loans as collateral sources. When rates rise, banks like the Federal Home Loan Bank of Boston (FHLB) will accept multifamily mortgages as collateral in exchange for low-cost advances.
Management’s structuring of Hingham’s loan book to take advantage of low-cost advances in rising rate environments has been a part of their operating model for thirty years and was a crucial source of funds relief pre-GFC.
Reliance on FHLB advances and a preference for efficiency-friendly brokered deposits have resulted in Hingham's historically weaker deposit base. On a 5-year basis, Hingham’s funding mix materially diverges from the average KRE bank, favouring a more deposit-seeking business model.
HLB Option Advances
On the specifics of Hingham’s advances, HLB Option Advances are presently favoured. An HLB Option Advance is simply an advance from the FHLB that is callable after a lockout period, which varies depending on the duration of the HLB Option. After the lockout period, the FHLB has a quarterly option to call an advance, with the primary call/hold motivation a function of interest rate variation.
Each HLB option has an initial yield and a maturity yield. The initial yield is the yield a purchaser pays at the onset of an HLB option, and the maturity yield is paid at advance maturation.
If interest rates rise, the FHLB will be more inclined to call an HLB Option to maintain a baseline spread. The advance borrower would then have the opportunity to purchase a higher-cost HLB Option to replace it or to seek alternative funds. Conversely, should rates fall, the FHLB will likely refrain from calling to achieve a higher spread.
Most of Hingham’s HLB Options have four and five-year durations, with respective starting yields of 3.5% and 3.25% and maturation yields of roughly 3.8% and 4%. Yield-to-maturity is approximately 3.65% for four-year HLB Options and 3.59% for five-year HLB-Options, preferential to five-year FHLB Classic Advances yielding 4.57%.
At the end of the third quarter, HLB-Option Advances constituted 20% of Hingham’s funding mix. As management is underwriting loans that yield upwards of 7%, Hingham’s ability to fund existing and new businesses through HLB-Options is an essential tool for capturing immediate funds relief and preserving capital. Recall that loan book growth has been 6.9% year over year. Over the same interval, Hingham’s deposits have experienced their first decline in thirty years, at a rate of -2.1% of tangible assets.
In a market where higher rates have resulted in increased competition for deposits, a traditional deposit model would offer less funds flexibility for a bank with a heavy fixed base. In turn, Hingham’s conservatism has given it a lifeline, for without access to low-cost advances, Hingham’s asset base would falter. Similar to 2003-2006, we will likely see a period of increased financialization of Hingham’s balance sheet until margins begin reversion.
As of the third quarter, Hingham has $531.7MM in unused FHLB advance capacity, which amounts to 13.96% of gross loans.
Incentives: KRE Correlations and Hingham’s Low-Cost Advantage
KRE Management Tenure and Bank Performance
In banking, incentives strongly influence economic performance and balance sheet composition. Indeed, the GFC was not caused by a lack of intelligence but by a lack of good behaviour.
“Banking is a very good business unless you do dumb things.”
— Warren E. Buffett
To explore the relationship between incentives and economic outcomes, my analysis measured banks' performance by their degree of executive ownership-to-total compensation (OTC). Theoretically, the more meaningful a banker’s ownership of their business, the more likely they are to behave in ways accretive to their bank’s long-term well-being.
However, during the OTC analysis, an interesting discovery was made regarding management tenure and loan performance. Segregation of banks based on average management tenure duration shows that long-tenured managers lag KRE averages on profitability but excel in loan performance during recessions. The longer the average management tenure of named executives and directors, the lower GFC net charge-offs were as a percentage of loans.
Interestingly, the >15 tenure group also features lower average risk exposure to HTM securities, lower NPLs, and higher OTC.
The findings imply that long-tenured management teams may be willing to accept lower returns in exchange for minimizing career risk, which is corroborated by relative risk-averse loan book construction.
More research is needed to scrutinize the credit risk of long-tenured loan book composition based on floating, adjustable, and fixed-rate allocations. However, first-level analysis identifies conservative attributes not shared by KRE averages. While these banks generally do not have differentiated characteristics that may be considered interesting on a single-name basis, the relationship between management tenure and conservatism may be worth exploring. In the interim, gauging management tenure to identify banks for holding personal or commercial deposits may prove prudent.
KRE Executive Ownership and Bank Performance
To analyze the relationship between insider ownership and bank performance, I isolated and measured the performance of seventeen KRE banks where annual executive OTC met or exceeded a multiple of seven times. Findings revealed profitability outperformance to be more muted than anticipated. However, in the context of less relative leverage and increased risk-consciousness in balance sheet construction, adjusting to match KRE averages would reveal higher profitability than featured. Unadjusted, >7x OTC bankers appear to strike a balance between performance and resilience.
For example, >7x OTC banks, like >15 tenure banks, were found to hold less HTM securities and sport strong loan performance. In addition, they maintain low derivatives exposure and preserve high cash holdings. Lower derivatives exposure implies a decreased inclination among owner-operators to sacrifice long-term profits for short-term comfort. At the same time, high cash holdings reflect an increased desire for balance sheet resilience.
Backtest: >7 OTC
To expand the investigation of incentives and their influence on economic outcomes, a backtest was constructed to measure >7x OTC stock performance. A total of thirteen >7x OTC names existed pre-GFC, which comprised the dataset. The backtest start point is Q2-end, 2009, following considerable price stabilization in the stock prices of US regional banks.
The back-test validated an assumed correlation between strong incentives and positive stock performance. Data reveals comparative outperformance over the S&P 500 for most of the 14.5-year test, with cumulative underperformance in 2023 due to aggregate sequential declines of -19.45% and -6.21% for >7x OTC banks in 2022 and 2023. Subtracting 2023, the >7x OTC basket produced outperformance equal to 2% annualized more than the S&P 500 over 13.5 years.
With the opportunity to apply the approach at materially lower prices during the GFC, >7x OTC as a factor is a conservative way for investors to obtain high performance in financials without selection bias risk, with current S&P inversion a reason to explore present application.
Additionally, two alternative back-tests were conducted to assess the relative strength of >7x OTC and the incentive-outcome relationship. The back-tests measured the historical stock performance of derivative-free banks and>15 tenure banks. Annual performance of both strategies, circa Q2 2009, lagged >7x OTC banks by -2.24% and -2.54%, respectively. A hope to discover alternative strategies to an ownership-centric one failed to materialize. That said, the derivative-free and >15 tenure back-tests were not exhaustive of possible alternative strategies, with further research needed to identify possible actionable strategies.
Hingham’s Management
Considering the role incentives played in producing the GFC, it is essential to understand who manages a bank and what incentives drive their behaviour when analyzing it.
Robert H. Gaughen, CEO, Age 71
Robert H. Gaughen has been with Hingham for over thirty years and has a long track record of underwriting creditworthy loans with impressive cross-cycle performance. When Robert took control of Hingham in 1993, its credit quality and loan book reflected the speculative underwriting practices that bore the 1986-1995 Savings and Loan Crisis. The bank was rife with non-performing loans, and was weighted some 40% in variable-rate residential mortgages. It was barely profitable, its deposits had not grown in five years, and its efficiency ratio flirted near 100%. To make matters worse, Hingham’s loan book had declined by a staggering 40.4% since 1988. Through heroic restructuring efforts to improve efficiency, profitability, and credit quality, by the end of 1994, Robert had grown Hingham’s loans by almost 25%, improved the bank’s efficiency ratio to 62.7%, stabilized deposits, and achieved a 16% ROE for the year.
Patrick R. Gaughen, President, COO, Age 42
When management is so vital to company performance, the most significant risk to long-term economic prosperity is the loss of key personnel. Fortunately for shareholders, COO Patrick Gaughen, Robert’s son, is just forty-two years old to Robert’s seventy-one. Patrick has been with the company for twelve years and is already apprenticing to replace Robert. Patrick oversees Hingham’s operations, co-authors annual remarks, and is the primary speaker at annual general meetings. Significantly, Patrick has learned from his father well and is a vocal supporter of Hingham’s low-cost operating philosophy. Influenced by Toyota’s Production System, Patrick prizes a continuous focus on simultaneous efficiency, process, and product quality improvements.
“If you want to be competitive in a commodity business, you need to be a low-cost producer.”
— Patrick Gaughen, 2023 Annual General Meeting
Hingham’s Low-Cost Competitive Advantage
Recall that Hingham’s NIM is lower than KRE averages, yet management has ever-expanded business returns and efficiency in excess of peers. If a bank can operate at half the cost of its competitors, it can afford to underwrite higher-quality loans at lower rates.
The motivation behind Hingham’s low-cost operation is a 30.3% stake held by executives and directors. The Gaughen family owns 15.4% of the company, which has remained unchanged since 1999. Robert’s ownership translates to a high multiple of his compensation, at 33.4 times, which helps explain Robert and Patrick’s combined owner-operator behaviour.
Advantageously, owner-operator incentive structures are costly to replicate, with just 12.3% of KRE executives owning more than seven times their annual total compensation in stock. Accordingly, producing owner-like incentives requires either material dilution of shareholders or significant insider investment in company stock. With a total of 4,001 US regional banks and high aggregate demand (KRE loans total $2.8 trillion in value), there is little incentive for regional bank executives to produce above-average results. Even the CEOs of banks with a mere $300MM-$650MM loan books average seven-figure annual compensation packages. What is in it for them that offers more than the lofty compensation they already receive?
Ode to Hingham’s Advantage, for Robert and Patrick’s successful operation of Hingham is beyond the mere collection of a paycheck: Hingham is the product of their life’s work. The results of their combined dedication have produced a business so unique and yet so simple. Hingham is the only bank in the dataset where there is, in concert, no material M&A, no derivatives exposure, no secondary lending business, no material HTM securities holdings, and, most interestingly, no regular stock-based compensation paid to executives. The Gaughens believe ownership is incentive enough.
There is no product innovation department at Hingham and no peddling of emergent asset classes. Management has but one goal: to underwrite simple loans that are likely to be repaid and maximize personal and shareholder wealth over time. Even Hingham’s dividend payout ratio speaks to a fixation on compounding internal business value, for it has averaged just 11% over the last ten years and 8.9% over the past five.
Incentives Drive Competitiveness: Columbia Financial (NASDAQ:CLBK)
During dataset analysis, it was important to investigate banks with similar operating models to Hingham for comparative purposes. Was Hingham’s business model responsible for its success, or were incentives a necessary additional component? If the former, there would be nothing stopping other banks from cloning Hingham’s model, but if the latter, then Hingham’s competitiveness would be difficult to reproduce. Through analysis of Columbia Financial, I got my answer.
Like Hingham, Columbia Financial focuses on multifamily CRE and 1-4 family residential mortgages. The bank also posts its multifamily loans as collateral to access FHLB advances when interest rates rise, of which Columbia’s advances presently exceed KRE averages by 85%, at 14.6% of liabilities.
With Columbia’s attributes, it would be reasonable to assume similar operating results to those of Hingham, but the opposite is true. Columbia’s cross-cycle loan performance and conservatism are reputable, but its efficiency and profitability substantially lag the average.
The crux that prevents Columbia from being excellent is an inefficient deposit-seeking model run by poorly incentivized management. The bank has 67 branches and 747 employees overseeing a modest $7.79bn loan book, which generated just $331.9MM in revenue per employee on a TTM basis.
There is no demonstrable reason why CLBK’s lacklustre performance cannot be remedied, but such mediocre results would be expected from a CEO whose ownership exceeds total annual compensation by just 2.2 times. In just five years, Columbia’s CEO, Thomas J. Kemly, has accumulated $18.8MM in cumulative total compensation.
The disparities between Hingham and Columbia speak to a trend in banking at the heart of this report’s findings: that incentives significantly impact a bank’s results more than its business model.
To provide another example, BancFirst (NASDAQ:BANF) is an Oklahoma-based bank with over 50% of its loans allocated to construction, C&I, consumer, and oil and gas loans. The economic sensitivity of BancFirst’s book is palpable. Still, under the watch of Chairman David E. Rainbolt’s 33% ownership, the quality of loans underwritten perform above average (peak GFC net charge-offs were a surprisingly low 0.3%), and the bank maintains a cash balance equal to 19% of tangible assets. The cherry on top is BancFirst’s ROE, which has averaged 13.92% over the past five years.
One must first start with incentives to build a competitive advantage in regional banking.
Interest Rates and Management’s Resistance to the Institutional Imperative
The institutional imperative is the phenomenon where business activity tends to be replicative. Companies often make business decisions that are thoughtlessly similar to competitors, even if the activity is counterproductive to optimal results. For instance, although we are likely on the forward end of the yield curve, interest rate swaps continue to be broadly maintained and repurchased by US regional bank executives.
The phenomenon is driven by the fear of a repeat of the 1970s-80s hyperinflation, which begs the question: Why have Robert and Patrick abstain from purchasing swaps?
“To the extent that we are looking at swaps… The opportunity to do something like that has probably already passed.”
— Patrick Gaughen, 2023 Annual General Meeting
Once a trade is popular on Wall Street, whatever easily capturable arbitrage existed prior will likely be closed. To buy after the fact is to hope that a trade that has worked recently will continue to work. What, then, must be the case for swaps to be worthwhile at present?
Interest rates must go higher.
If rates rise from present levels, it means a return to inflation above expectations. With many factors that caused inflation during the COVID-19 pandemic now resolved, to be an inflation bull is to be creative, especially in the face of median housing affordability woes.
Take the National Home Ownership Affordability Monitor (HOAM), for example. The HOAM is used to gauge US median housing affordability, and the minimum threshold required for median housing affordability is 100. While a score above 100 indicates relative affordability, a below 100 indicates low affordability. As of this writing, the HOAM has been at its lowest since the GFC.
Higher interest rates have also severely impacted first-time homebuyer rates in the US, with affordability for the category the lowest since the start of the data.
Whenever housing affordability regresses in the US, it typically precedes a financial crisis. This was the case before the Savings and Loan Crisis and pre-GFC. Considering national median affordability has been maintained since the GFC on account of ultra-low interest rates, significant deflation, wage inflation, and/or lower interest rates must occur to restore median affordability. Otherwise, there is a risk that half of the US population and first-time homebuyers will be left behind.
Asset deflation would hurt existing owners and may result in the proliferation of underwater mortgages. At the same time, wage inflation has returned to mean annual levels and would challenge the Fed’s inflation reduction efforts. A decrease in interest rates could similarly heighten the risk of inflation regaining upward momentum. Still, it is hard to ignore that, even after a -12.7% decline in median home prices since Q4 2022, affordability remains constrained due to higher borrowing costs.
Median households are more sensitive to debt than in the past, as US household debt levels are 47% higher today than in 1981. Adjusting for the increase, the cost of a 6.79% 30-year fixed rate mortgage today is comparable to 10% in 1981: a rate not seen since 1990.
Even though rates point towards moderation, the behavioural significance of Robert and Patrick’s avoidance of swaps should not be ignored. Hingham is one of the most liability-sensitive banks in the dataset. So, not only is management’s declination of swaps a vote of confidence in the strength and structure of Hingham’s balance sheet, but their behaviour is in stark contrast to the status quo.
Imagine that most of your wealth is invested in a rate-sensitive bank you run. Think about the strength and conviction it would take not to hedge away short-term discomfort amid history's most protracted yield curve inversion.
Robert and Patrick’s steadfast courage reflects an old-time desire to maintain a successful lending practice focused on simple and honest underwriting without undue complexity.
“[Our philosophy] is ‘simple banking, honest value.’ A business philosophy that prods us to remain focused on the basics to avoid the cluttered groupthink of competitors and the panicked ‘sky is falling’ cackling of the consultants.”
— Robert Gaughen, 2015 annual remarks
Stress Test and Valuation
Stress Test
On a year-over-year basis, the cost of Hingham’s liabilities has expanded 280 basis points, from 1.13% to 3.93%, while its yield on interest-earnings assets has increased 64 basis points, from 3.68% to 4.32%. The extent of this mismatch is due to rate rises outpacing loan adjustments and originations at a greater tempo than historically.
If interest rates experience another rapid ascension, Hingham may probably undergo a period of losses before conditions improve. If this were to occur, mortgage originations for multifamily properties would further slow as borrowers curtail new investments, while Hingham’s loan and cash adjustments would offer only modest funds relief.
To unfairly appraise the extent of Hingham’s survivability, I orchestrated a stress test that assumes a 2% increase in the Fed Funds Rate to 7.25-7.5% without any change in Hingham’s earning assets. Were such conditions to transpire, Hingham would incur losses of roughly $25.2MM annually, or $6.3MM per quarter, against $354MM in cash.
Encouragingly, even with added stress, prospective losses should be tolerable thanks to Hingham’s balance sheet strength.
As a caveat, Hingham’s long-term well-being is not necessarily contingent on low or high interest rates but on yield curve stabilization. Should rates remain where they are, Hingham’s primary hurdle to achieving economic normalization will be time. Eventually, Hingham’s loan book will fully turnover, with patient shareholders rewarded for their dedication.
Valuation
When thinking about the prospective returns of a business, an investor must understand the economic and behavioural structures responsible for past and present results. While cost is a barrier in producing incentives that inform Hingham’s operational prowess, the bank is home to an industry that sells commodified services with little pricing power. As a result, Hingham enjoys no autonomic attributes that businesses of systemic necessity enjoy, like US rail transportation companies, to protect against managerial folly.
With this in mind, any projection of Hingham’s future economics must be made in tandem with a commitment to monitor Gaughen’s ownership, as owner-operator incentives are likely to be a more accurate predictor of long-term economic success than a cursory glance at its historical figures.
Hingham is GFC Cheap
The last time Hingham’s shares traded at 1.04x book value was in June 2009. In light of Hingham’s economic superiority, total shareholder returns have been 16.9% since that period, despite Hingham’s stock being 54% off its prior highs.
Hingham is also currently in a period where the business is under-earning, so returns for those who purchased shares in 2009 are likely to average higher as business conditions improve. For comparison, when Hingham was over-earning in 2021, annual returns for 2009 purchasers had been 27.2%, compounded.
Growth Value Model Analysis
I conducted a growth value model analysis (GVM) rather than a standard discounted cash flow analysis (DCF) to value Hingham. While a DCF encourages more granular assumptions about a company’s future cash flows, a GVM inspires engagement with the likely future growth and returns of a company’s equity. Because a bank’s equity performance is a crucial driver of the market's valuation of banks, a GVM was preferred over a DCF for Hingham’s valuation.
Before sharing my model and its assumptions, it is essential to provide context by discussing Hingham’s past performance.
Regarding book value growth, Hingham has posted a steady rate of 12% per annum over the past twenty years, 15.3% per year in the most recent ten, and 15.7% in the last five.
For loan growth, management has compounded Hingham’s loan book by 14.4% over the last ten years and 14.8% over the past five. Meanwhile, ten-year ROA has averaged 1.4%, and lifetime core ROE (ROE ex gains on sales of securities and fixed assets) has averaged 13.53%.
Because of Hingham’s small loan book and competitive stature, the business is positioned to continue compounding book value between 12% and 15% over the next decade while simultaneously driving ROE improvements through efficiency initiatives. However, predicting a business's future economics based on historical performance is difficult. If rates remain unchanged, it will take time for Hingham’s operations to normalize.
But, even if we apply conservative expectations about Hingham’s economic future, forward returns from its present $417.47MM market capitalization are impressive.
For my model, I conducted five- and ten-year projections. On a five-year basis, I assume average book value growth of 10.43% and 9.83% average asset growth. In addition, I think an average ROE of just 9.23%, with ROA recovering to Hingham’s 27-year average of 1.16% by 2027. Regarding valuation multiples, I assume Hingham’s 27-year average is 12.4 times the price-to-earnings ratio (P/E), and its 27-year average is 1.6 times the price-to-book (P/B).
On a ten-year basis, I assume 10.65% average book value growth, a -30.4% reduction compared to Hingham’s prior decade, and 10.4% average asset growth. I also input 2033 ROE of 11.93% and 10.96% on a ten-year basis, which is -19% below the lifetime average core ROE. Lastly, I keep ROA fixed at 1.16%.
Based on the prior assumptions, we get the following results:
Should my model’s expectations materialize, by 2028, Hingham will have a market capitalization between $1,017.2MM and $1,067.8MM, which would produce a five-year compound annual growth rate (CAGR) between 19.50-20.66%. By 2033, the model implies a market capitalization between $1,714MM and $1,850.5MM, which would produce a 10-year CAGR between 15.17-16.06%.
Discussion
In valuing an owner-operated business, there is a margin of safety in imagining future results that will likely disappoint management. The logic is simple: The poorer an owner-operator’s performance, the less personal wealth they will accumulate.
If Robert and Patrick meet the projections of my GVM over the next decade, Hingham’s economics will mark a notable departure from past performance. Take book value growth: A ten-year average growth rate of 10.65% would not necessarily be worst-case given the extent of Hingham’s current challenges, but it would be surprising concerning the company’s economic position.
Even more notable, to average a 10-year ROE of 10.96% would not only lag Hingham’s 30-year average GAAP ROE, but it would also underperform lifetime average core ROE. The decline would be a thorn in management’s efficiency efforts and produce uncharacteristically low earnings growth. Supposing my model’s ROE expectations run true, by 2033, Hingham will have grown 2021 peak-cycle earnings of $67.46MM by just 6% per year to $135.14MM. This would compare unfavourably to Hingham’s 11.7% earnings growth rate of the prior decade (dilution has been non-material).
With such conservative assumptions, a prospective forward return between 15.17-20.66% is a return profile double S&P 500 total forward returns of 8%, and that is assuming no multiple or margin fade for the index and no potential tax hikes.
Hingham is also a unique opportunity because it offers investors uncorrelated protection as a recession-resistant asset. A purchase of Hingham stock may be a suitable fit for an investor looking to gain exposure to assets that perform well during economic turmoil. During the GFC, most of Hingham’s share price declines occurred before the crisis. When the market began to decline in October 2007, Hingham shares had already fallen -31.5% over the prior two years due to rate hikes. While Hingham’s share price would decrease by another -16.6% to a low of $17.83 in March 2009, the S&P 500 would lose roughly 50% of its value over the same period. By the second quarter of 2010, Hingham’s share price had fully recovered to 2005 highs, while the S&P 500 would not see a full recovery until the third quarter of 2013. Today, Hingham is a demonstrably better business run by an even more experienced management team, and it is up for grabs at GFC prices.
Risks
Although two of Hingham’s primary risks, key personnel and interest rate risk, have been discussed throughout this report, one more risk deserves attention before the report concludes.
Multifamily Supply
When deciding to underwrite a multifamily mortgage, a responsible underwriter must not merely seek a reasonable LTV and adequate income to satisfy the security of the principal; a responsible underwriter must also assess the economic and geographic qualities of their chosen market to ensure a high likelihood of multifamily price stability over time.
Market features that favour multifamily price stability are:
· High density
· Urban infill development policies
· Land scarcity
· High wage growth
· Commerce
A densely populated urban center characterized by land scarcity, typically due to vertical building or land restrictions, tends to produce long-term stability in home prices, as limited space begets limited housing opportunities and low vacancy rates. These dynamics benefit most from public policy that favours infill land development versus suburban development, which aims to transform unused urban property into multifamily housing. Such policies also encourage the development of solid transit systems that make urban living attractive for residents.
Commerce also plays an important role in long-term, upward price mobility. Port cities like Boston, Hingham’s largest urban market, attract sizeable investment and seaborne trade. In addition, the city is home to Ivy League heavy hitters MIT and Harvard and is a major finance hub. It should come as no surprise that the median household wealth in Massachusetts is significantly above the national median.
Data from the St. Louis Fed shows that real median household income in Massachusetts has grown by 3.32% per year since 1984 versus 0.72% nationwide. The disparity has translated to $18,970 more annual income per median Massachusetts household than the national median.
Real Median Household Income in Massachusetts
Real Median Household Income in the United States
Moreover, Massachusetts vacancy rates are a low 2.5%, versus 6.6% for the national average, a 62% difference. Massachusetts rental properties also fared much better during the GFC, with vacancy rates flat throughout the crisis.
Rental Vacancy Rate in Massachusetts
Rental Vacancy Rate in the United States
Building an apartment in Boston takes upwards of four years, and mere build plan approval takes over 600 days in San Francisco. The dynamics of Boston and San Francisco do not have to be as extreme to maintain price stability, as sustained low affordability risks a city’s long-term health and vibrancy. The latter has been apparent in San Francisco post-Covid-19, where pandemic population outflows due to remote work trends and tech industry job cuts have pressured multifamily housing prices. Luckily for Hingham shareholders, management entered the San Francisco Bay Area (SFBA) in 2021 following sizeable declines in multifamily prices. Management remains cautious in their entrance and plans to scale SFBA operations as conditions settle.
Considering factors important for multifamily price stability, the most significant risk to long-term multifamily prices in Boston and San Francisco is not a loss of their geographic and economic importance over time. The risk is that continued unaffordability may incite legislation favourable to sustained increases in multifamily housing supply. In response, long-term multifamily values may be less committed, which could decrease Hingham’s credit quality re LTV contraction and negatively impact Hingham’s FHLB advance capacity.
Trading Strategy and Position Sizing
“If a stock goes from bad to okay, it goes north. If it goes from okay to good, it goes north. If it goes from good to great, it goes north.”
— Peter Lynch, 1994 Fidelity Investor Conference
Trading Strategy
When Hingham enters a period of over-earning, its share price tends to trade at or above a P/B multiple of 2.2 times, which has historically been a sell signal. Conversely, a P/B ratio of 1.2x or less has been a buy signal. If ROE recovers to mid-teens, Hingham will likely once more be valued at its upper historical range in the next economic cycle.
As a result, late-cycle conditions, plus a P/B multiple of 2.1x, should provoke a stop-sell trade order priced at a ten percent discount for a minimum sell multiple of 1.9x. The stop-sell should be adjusted upwards at a 10% discount to market if Hingham’s stock continues to rise, with a P/B ratio of 2.5x, marking an immediate closure of a position. When a new minimum sell multiple is set, it should not be adjusted downward if Hingham’s stock price sequentially declines.
This strategy is intended to guarantee attractive baseline profits while offering concurrent protection against super deprival reaction syndrome risk. To further reduce the risk of eliciting market panic, a stop-sell order should not exceed two percent of a stock’s daily average trading volume.
The stop-sell strategy also automates the beginnings of a position’s exit to counter anchoring and recency bias based on a multiple indicative of unusually high earnings and profitability. Investing in a liability-sensitive business like Hingham requires a disciplined exit window based on business fundamentals, as high multiples coupled with above-average profitability tend to be a temporary phenomenon.
Were the prior strategy implemented, a purchase of Hingham stock at $21.70 on June 1st, 2009, would have been sold in December 2016 at a multiple of 2.5x book, for a 6.5-year CAGR of 36.16%. The proceeding years produced moot returns for Hingham shareholders until a buy multiple of 1.2x P/B was hit in the Covid-19 Pandemic Crash.
Position Sizing
An investment in Hingham is to assume duration risk, as it could be a few years before Hingham’s business normalizes. Consequently, investment in Hingham is likely unsuitable for anyone with a time horizon of fewer than three years. Moreover, Hingham’s sensitivity to higher interest rates may make it difficult to justify to retail clients who fear investing in liability-sensitive businesses.
To minimize the risk of client redemptions, a maximum weighting of 12% in Hingham stock may be prudent for a firm that manages accredited investor wealth. For retail-facing firms, given the importance of maintaining client behavioural comfort, a maximum weighting of 4-6% may be more advisable.
Conclusion
I painstakingly analyzed the US regional banking industry on the hunch that Hingham was unique. While other banks of interest were uncovered during dataset analysis (which I selfishly omitted for personal and professional use), my work made clear Hingham's competitive prowess.
Hingham has the best average cross-cycle performance of any bank in the dataset. Few banks have bested Hingham’s ROE across the economic cycle, and its loan performance and efficiency are unmatched. Should its trajectory resume, I believe that Hingham’s top-tier ranking as a regional bank will become broadly known in my lifetime. As an investor who cares deeply about partnering with managers who run their businesses with care and dedication, I feel fortunate to have found such a wonderful business.
On a more personal note, when I first analyzed Hingham, I was one of those investors who thought themselves incapable of understanding banks and, therefore, unsuited for bank ownership. Thanks to Robert and Patrick Gaughen’s insistence on running a simplified operation, I was inspired to challenge my biases and test the limits of my understanding.
In the process, I received the honour of presenting Hingham at MOI Global’s Best Ideas Conference in January and discovered that there are knowable banks worth uncovering for those willing to explore them.
“There is no substitute for hard work.”
— Patrick Gaughen, 2023 Annual General Meeting
Signed,
Gwen Hofmeyr
Disclosure: The author, editor or the accounts advised by the editor may own shares in Hingham. This post is for informational purposes only and we may be wrong in our assumptions and estimates. We encourage all readers to come to their own conclusions.











I find this whole discussion annoying. HIFS posts a good efficiency ratio because its deposit franchise is tiny and it funds loans with wholesale borrowing. Any idiot can create a bank that borrows short term wholesale and lends out of area on national credits and post a terrific efficiency ratio. In fact, tons of idiots that run M-REITs have done precisely that. And that’s what HIFS is, an M-REIT. This is not a quality bank. You are evaluating it based on an historically favorable interest rate period.